
Moody’s downgraded the United States credit rating from Aaa to Aa1 on May 16, 2025, citing long-term fiscal deterioration. The downgrade ended a century-long era in which the US held a perfect credit rating from all major agencies.
S&P downgraded the US in 2011, and Fitch followed in 2023. Moody’s downgrade leaves the country without a top-tier score for the first time since the rating system began.
The agency pointed to soaring public debt, rising interest payments, and the lack of a sustainable fiscal framework. Data from the U.S. Department of the Treasury shows total public debt has now crossed $34.7 trillion, up from around $23 trillion in 2019. The chart from FRED (Federal Reserve Economic Data) confirms a steep rise in debt starting around 2020, with the curve accelerating sharply after pandemic-era stimulus packages.
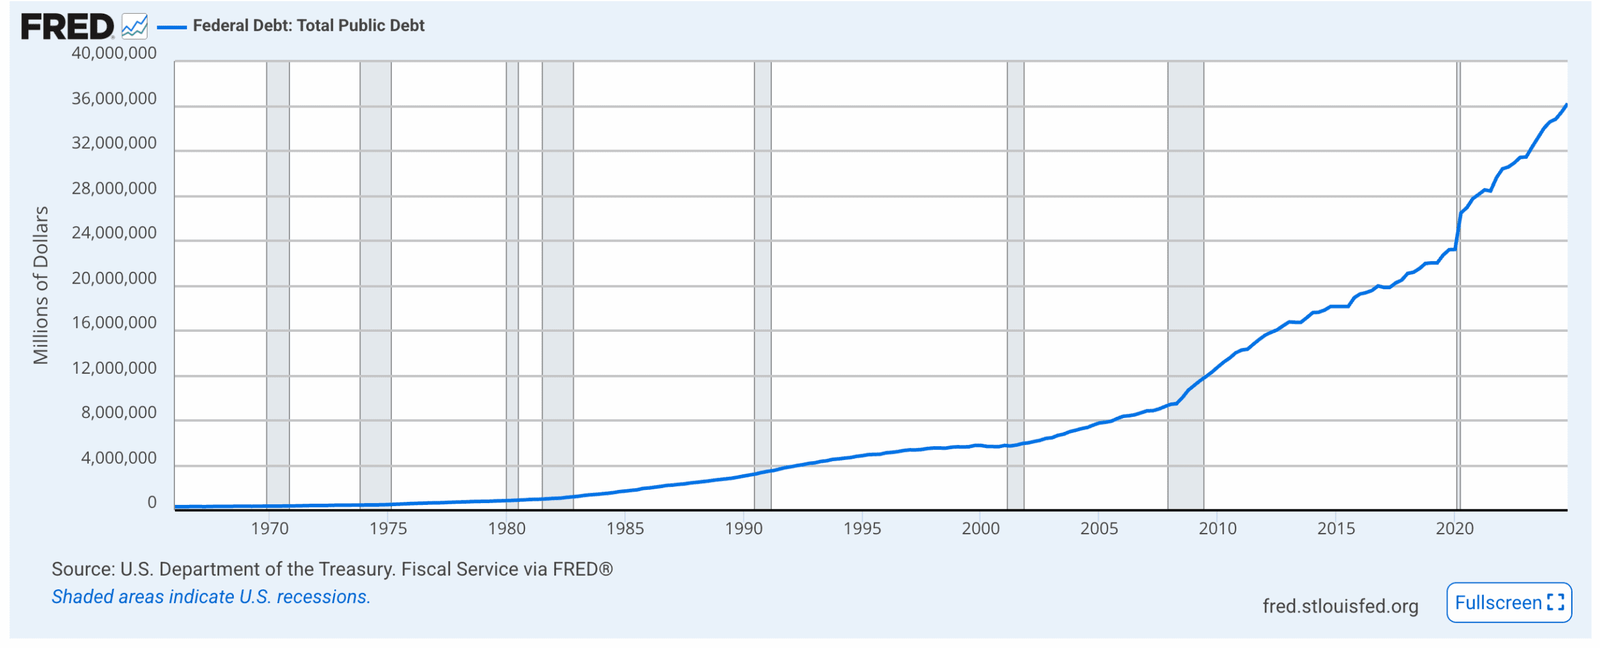
The visual trend shows that between 2000 and 2020, debt levels increased steadily. However, post-2020, the pace turned exponential. By 2024, total federal debt approached the $34 trillion mark. As of Q2 2025, the trajectory remains upward, with no visible signs of slowing.
This downgrade coincides with a lack of agreement in Congress over a $3.8 trillion tax and spending proposal. Moody’s warned that if Trump-era tax cuts are extended without offsets, the annual deficit could reach 9% of GDP by 2035.
Markets reacted swiftly. US Treasury yields increased, reflecting concerns about long-term borrowing costs. Equity futures dipped following the news. The White House dismissed the rating action, stating it was politically motivated, but did not release additional policy guidance or counter-data.
Moody’s also flagged systemic risks in the federal budget structure. Without substantial policy changes, the agency warned that debt servicing costs will consume a larger share of the national budget, making fiscal reform harder in the future.
This downgrade does not change existing bond terms, but it does affect borrowing costs and investor sentiment. US sovereign debt is still considered safe globally, but the absence of a triple-A rating from all agencies may prompt reassessments in global fixed-income portfolios.
Bitcoin Supply on Exchanges Hits New Lows, Mirrors Rising Holder Confidence
Between April 17 and May 2, Bitcoin supply on exchanges dropped from 1.47 million to 1.42 million BTC, according to Santiment. The figure briefly increased to 1.43 million BTC by May 7, but the upward movement was short-lived.
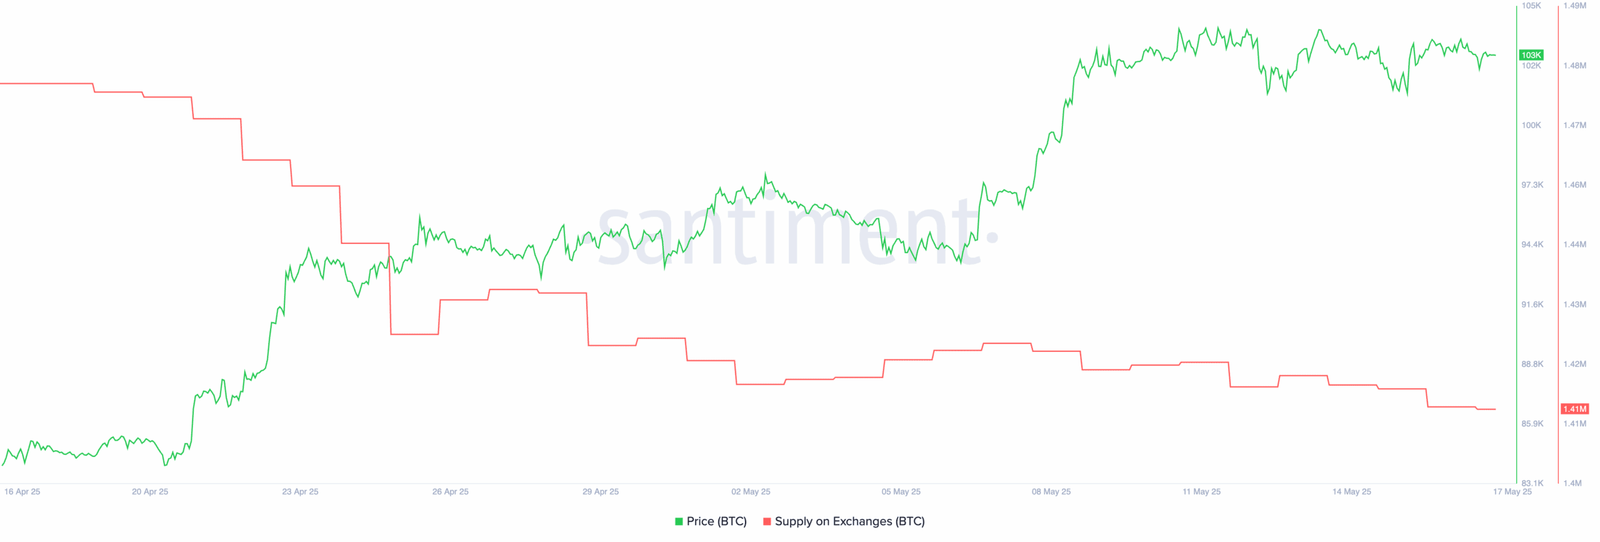
As of May 17, 2025, the supply has fallen again to 1.41 million BTC, marking a fresh local low in exchange balances. This drop comes despite recent price fluctuations, with Bitcoin price hovering around $103,000, as shown in the same data set.
The Santiment chart shows a steady decline in red (exchange supply) against a rising green line (BTC price), particularly from late April through mid-May. The divergence between exchange balances and market price often signals growing investor preference for self-custody.
When traders reduce their holdings on exchanges, it suggests a shift from short-term speculation toward longer-term storage. This behavior reduces immediate sell pressure, especially during uncertain macroeconomic conditions.
The chart also shows that this trend has remained consistent even after Bitcoin crossed above $100,000. While price movements continue to fluctuate in a narrow range, supply trends show investors may be choosing to wait rather than sell at current levels.
This current figure—1.41 million BTC on exchanges—represents the lowest level since early April. Previous resistance levels in this metric have now shifted downward, reflecting broader caution across both retail and institutional holders.
Such movements are important for market structure analysis. Declining exchange balances often align with accumulation phases. Although not predictive on their own, these supply dynamics form a key part of investor behavior tracking.
Bitcoin Price Tracks $103K as Ichimoku Cloud Stays Flat
Bitcoin is trading near $103,246 on May 17, 2025, according to a 4-hour chart from TradingView. The Ichimoku Cloud indicator shows a consolidation phase with no clear breakout signal in sight.
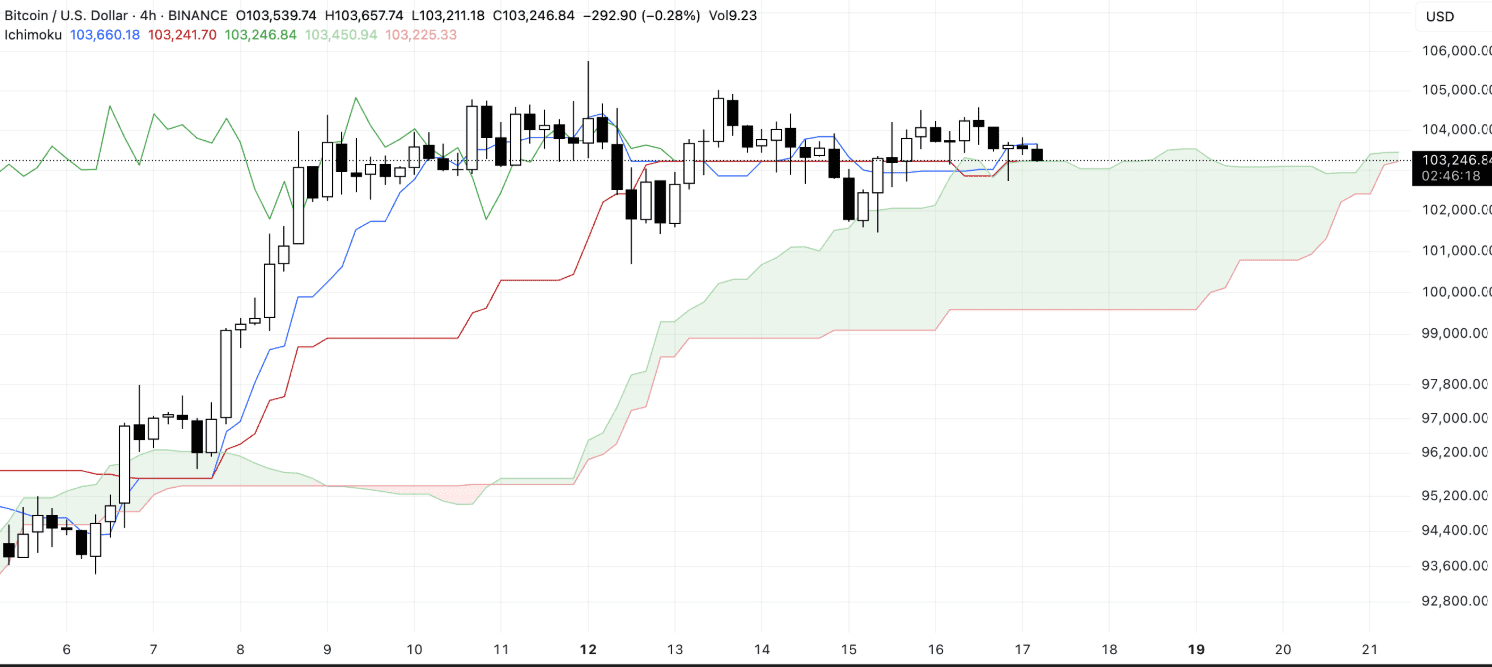
The Kijun-sen line (red) sits at $103,241, closely aligned with the current price. This flat position signals a balanced market, with neither buyers nor sellers dominating. The price has moved sideways along this line for several sessions, pointing to reduced momentum.
The Tenkan-sen line (blue) reads $103,660, just above the current level. Its flat slope reflects short-term indecision. There is no curve upward or downward to suggest immediate trend development.
The Senkou Span A and B lines, which form the green cloud, remain horizontal between $103,450 and $103,225. The cloud’s thin and flat shape indicates a lack of volatility and weak trend strength. Price is currently sitting at the upper part of the cloud, typically seen as a soft support level.
Meanwhile, the Chikou Span (green lagging line) is slightly above most recent price candles. This position could reflect minimal bullish sentiment. However, without rising cloud structure or a cross above resistance, no trend confirmation is present.
This flat Ichimoku setup has held since May 11, despite several attempts by BTC to break above $104,000. The lack of divergence between the indicator’s components suggests the market remains in equilibrium.
BTC volume is also light, with the chart showing no large candle movements across the past 48 hours. Unless price breaks above the cloud’s top or below its base, the trend may stay in this range.
Bitcoin Faces Key Resistance at $105,755 as Weekly Momentum Slows
Bitcoin is currently priced at $103,166, according to the weekly BTC/USD chart on TradingView, published May 17, 2025. Price action remains capped below a visible resistance zone around $105,755, which has rejected multiple breakout attempts over the past two weeks.
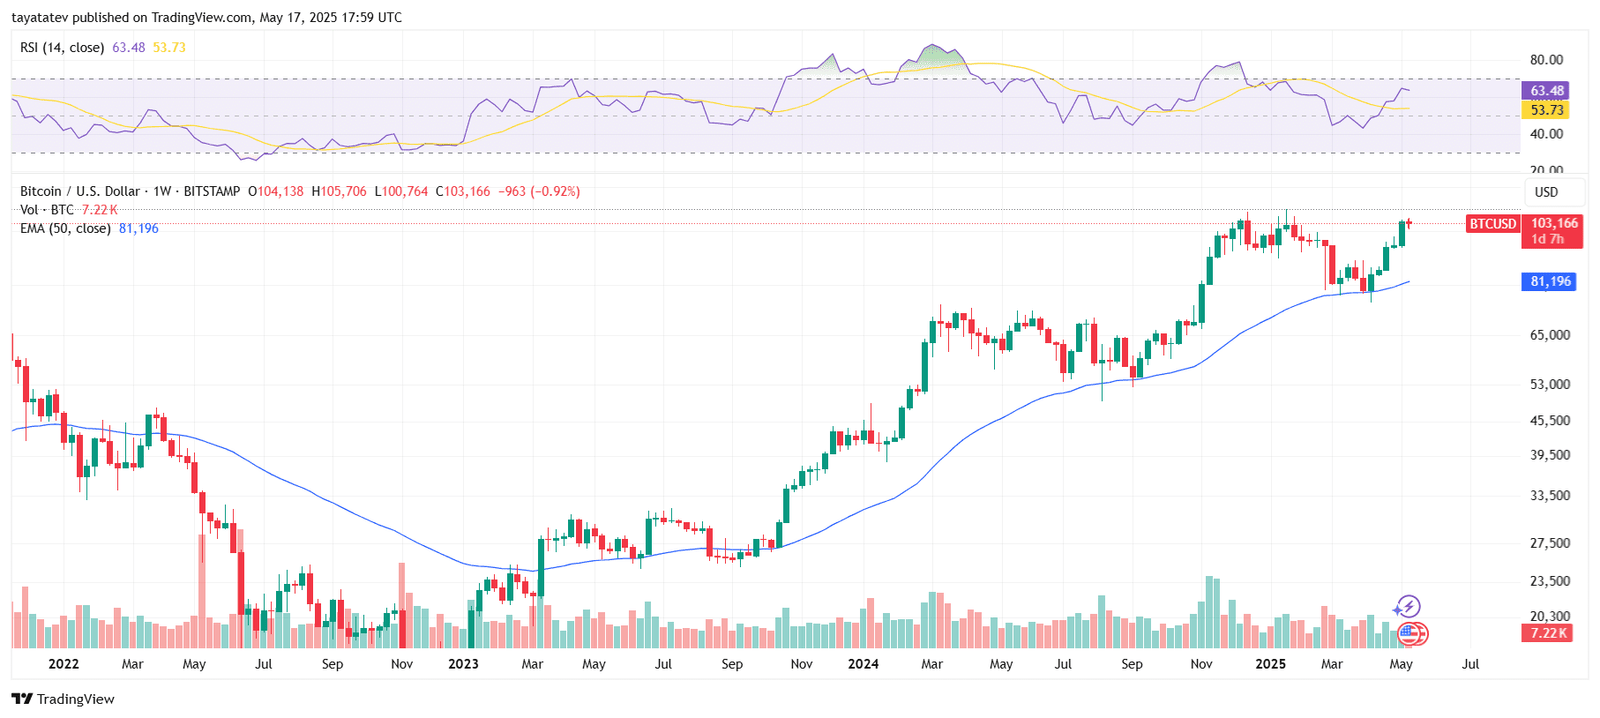
This resistance zone aligns with the top of a weekly candle wick printed in early May 2025. Bulls have tested the level several times, but no candle body has closed above it. The upper rejection suggests that sellers remain active near that price range.
Support sits at $100,694, the lower bound of recent weekly consolidation. If this support breaks, the chart shows potential downside targets at $98,002, followed by a lower level near $93,422. These were last seen during price pullbacks in April 2025.
The 50-week Exponential Moving Average (EMA) stands at $81,196. Price remains well above it, indicating longer-term bullish structure is intact. However, recent weekly candles show shorter bodies and upper wicks, reflecting slowing upward momentum.
On the Relative Strength Index (RSI), the 14-week reading is 63.48, hovering just above the midline but well below the overbought threshold of 70. The RSI’s slope is slightly upward but not steep, confirming that bullish strength is present but not accelerating.
Volume on the most recent weekly candles has decreased slightly. Current volume is 7.22K, lower than peaks seen during the February–March breakout. This volume fade suggests that the recent rise above $100,000 was not accompanied by a strong increase in buying pressure.
Despite EMA positioning remaining favorable, the flattening price behavior and weaker RSI slope indicate consolidation. For bullish continuation, Bitcoin would need to close a weekly candle above $105,755 with higher volume.
Bitcoin Holds Ground as US Debt Concerns Rise
As the Moody’s US credit downgrade removes the final top-tier rating, Bitcoin’s market role is back in focus. Fiscal instability and long-term deficit projections have brought more attention to Bitcoin price behavior.
Although Bitcoin remains in a tight trading zone, the ongoing drop in BTC supply on exchanges, combined with flat technical indicators, shows indecision. Investors continue watching resistance and support levels closely.
