
Bitcoin’s presence in global finance has shifted in 2025. Once viewed as a fringe asset, it is now being adopted as part of national reserves and corporate balance sheets. A new trend is unfolding as governments and institutions reframe Bitcoin as a strategic hedge, not a speculative bet.
According to Bloomberg data, over $6 billion entered U.S.-listed Bitcoin ETFs in May alone. BlackRock’s IBIT led the inflows, surpassing $70 billion in assets under management, and becoming the fastest-growing ETF in U.S. history.
The inflows reflect strong institutional conviction. Under the Trump administration, the U.S. established a Strategic Bitcoin Reserve through executive order. Officials framed the move as a diversification effort, designed to protect against currency risk and global instability.
Monty Metzger, CEO of LCX, called it the beginning of a broader shift. He said corporations will follow states in hedging against fiat currency devaluation. According to Metzger, tokenization links traditional markets with blockchain, enabling a multi-trillion-dollar global crypto economy.
Kevin Lee, Chief Business Officer at Gate, said 2025 and 2026 would bring major structural changes. He cited institutional integration, regulatory clarity, and technical scalability as key drivers.
“Now that Bitcoin ETFs are part of the financial system,”
Lee said,
“institutions will continue to adopt crypto through custody services, settlements, and treasury diversification.”
Institutional Adoption Raises Concerns Over Risk and Centralization
Although adoption is growing, some experts warn of hidden risks. Allan Bartholomew, Founder of Aspire Capital, noted that May’s ETF surge may not indicate long-term confidence. He pointed to lingering regulatory uncertainty, citing the SEC’s position on custody rules and market manipulation.
Bartholomew also highlighted systemic vulnerabilities. He referenced Bitcoin’s 28% drop earlier this year and warned that future volatility, liquidation events, or economic shocks could shake investor confidence.
“Retail enthusiasm might drive ETF demand,”
he said,
“but that doesn’t eliminate risks tied to unregulated markets and external pressure.”
Another concern is centralization. With Wall Street now controlling large ETF shares, some in the crypto community see a threat to Bitcoin’s decentralization.
Mike Ermolaev, Founder of Outset PR, warned that concentration of supply among a few asset managers introduces single points of failure. He said mass adoption, while a validation of Bitcoin’s financial role, could compromise its founding ideals. “The irony,” Ermolaev added, “is that Bitcoin’s relevance may cost its independence—unless users defend self-custody and protocol-level decentralization.”
Public Companies and Sovereigns Set New Precedents
The next stage of Bitcoin’s development may involve sovereign governments and public firms holding BTC as part of treasury planning. Alex Andera, CMO of Algos One, said more listed companies are adding Bitcoin to their books to hedge against inflation and monetary instability.
He added that sovereign adoption will follow, further signaling Bitcoin’s transformation into a store of value. “It’s no longer just a speculative asset,” Andera stated. “We’re watching Bitcoin evolve into a sovereign-grade reserve.”
As adoption spreads, infrastructure must scale. Gate confirmed it will continue expanding its product suite to support institutional demand. Kevin Lee said Gate’s roadmap includes investment in infrastructure, global access, and long-term crypto solutions tailored to institutional users.
Bitcoin’s place in finance now spans national policy and corporate planning. As adoption spreads through both public and private sectors, its role in the global economy is being redefined in real time.
Bitcoin Breaks Out of Bullish Flag, Eyes 29% Move Toward $141K
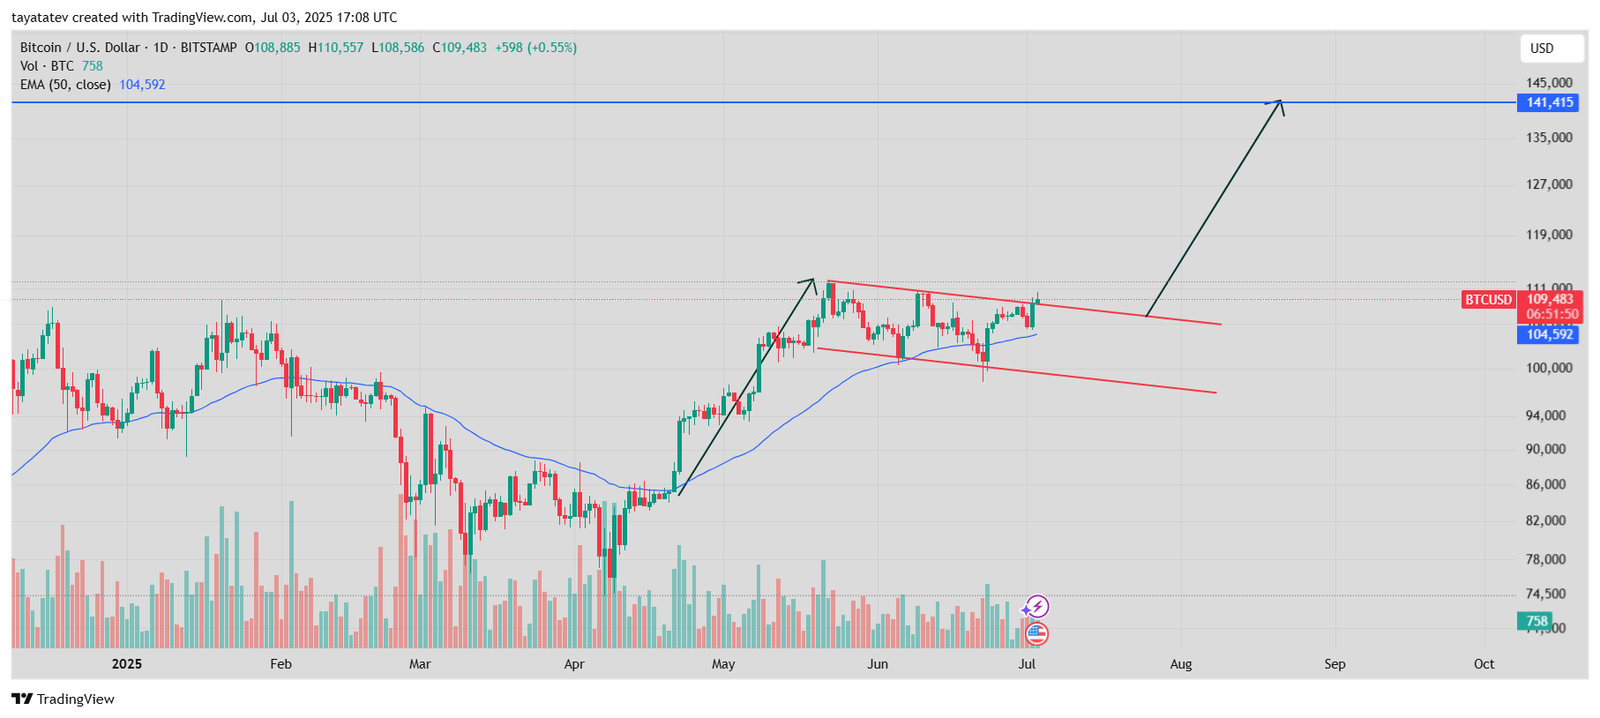
On July 3, 2025, Bitcoin BTC/ USDT formed and broke out of a bullish flag pattern on the daily chart, signaling the potential for a strong upward continuation. The pattern appeared after a steep rally that began in April and peaked near $109,500, forming the flagpole. Since then, Bitcoin traded inside a downward-sloping parallel channel—marked by lower highs and lower lows—typical of a consolidation phase known as a flag.
Source: TradingView
Technical analysts define a bullish flag as a continuation pattern that emerges after a sharp price increase, followed by a short period of downward or sideways consolidation. The breakout usually occurs when the price closes above the upper boundary of the flag, suggesting that the earlier uptrend may resume.
In this case, Bitcoin broke above the upper resistance of the flag near $109,500 while holding above the 50-day exponential moving average (EMA), which stood at $104,592. The breakout candle also showed increased volume, adding confirmation to the pattern. If the move holds, the price could rise approximately 29% from the breakout point, targeting $141,415 based on the height of the previous rally.
As of the chart date, Bitcoin was trading at $109,483. If bullish momentum continues, the breakout could carry the price toward the projected target in the weeks ahead.
Bitcoin RSI Chart Shows Bullish Momentum Building Above Neutral Zone
The Relative Strength Index (RSI) chart for Bitcoin shows a bullish momentum shift after a recent recovery from sub-50 levels. The RSI (14-day) value stands at 59.88, while its moving average (yellow line) sits at 52.31. This spread reflects rising buying pressure.
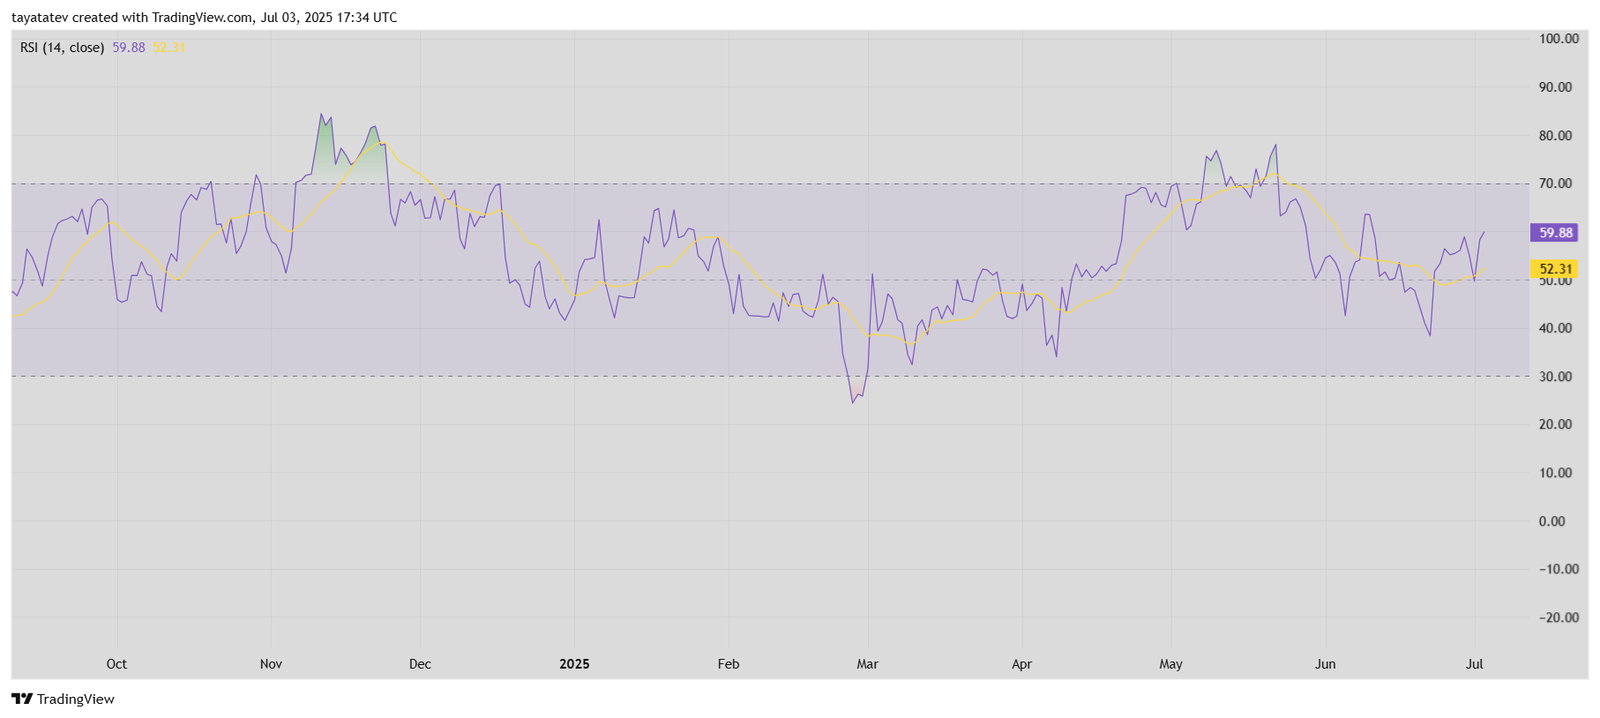
The RSI is a momentum indicator that measures the speed and change of price movements. It ranges from 0 to 100:
Values above 70 usually signal overbought conditions.
Values below 30 often indicate oversold conditions.
The 50 level acts as a midpoint, helping define trend direction.
Earlier in June, Bitcoin’s RSI dropped below 50, reflecting waning strength during its consolidation phase. However, since late June, the RSI has climbed steadily and now holds near 60, suggesting buyers are regaining control. The RSI line crossing above its moving average further confirms this shift in momentum.
If the RSI continues rising and stays above the 50 mark, it may support a sustained uptrend, especially after the confirmed bullish flag breakout shown in the previous chart. As momentum builds, traders often look for the RSI to approach or exceed 70 before anticipating exhaustion.
Bitcoin DMI Chart Shows Bullish Bias Gaining Strength in July
Meanwhile, the chart, created on July 3, 2025, displays Bitcoin’s Directional Movement Index (DMI) on a daily timeframe. The DMI uses three lines to assess trend strength and direction:
+DI (blue) shows buying pressure.
–DI (orange) reflects selling pressure.
ADX (pink) measures trend strength, regardless of direction.
As of the latest data:
+DI = 22.95
–DI = 19.50
ADX = 11.80
This setup shows that buying pressure has crossed above selling pressure, which is a bullish signal. The blue line moving above the orange line indicates that bulls are regaining control.
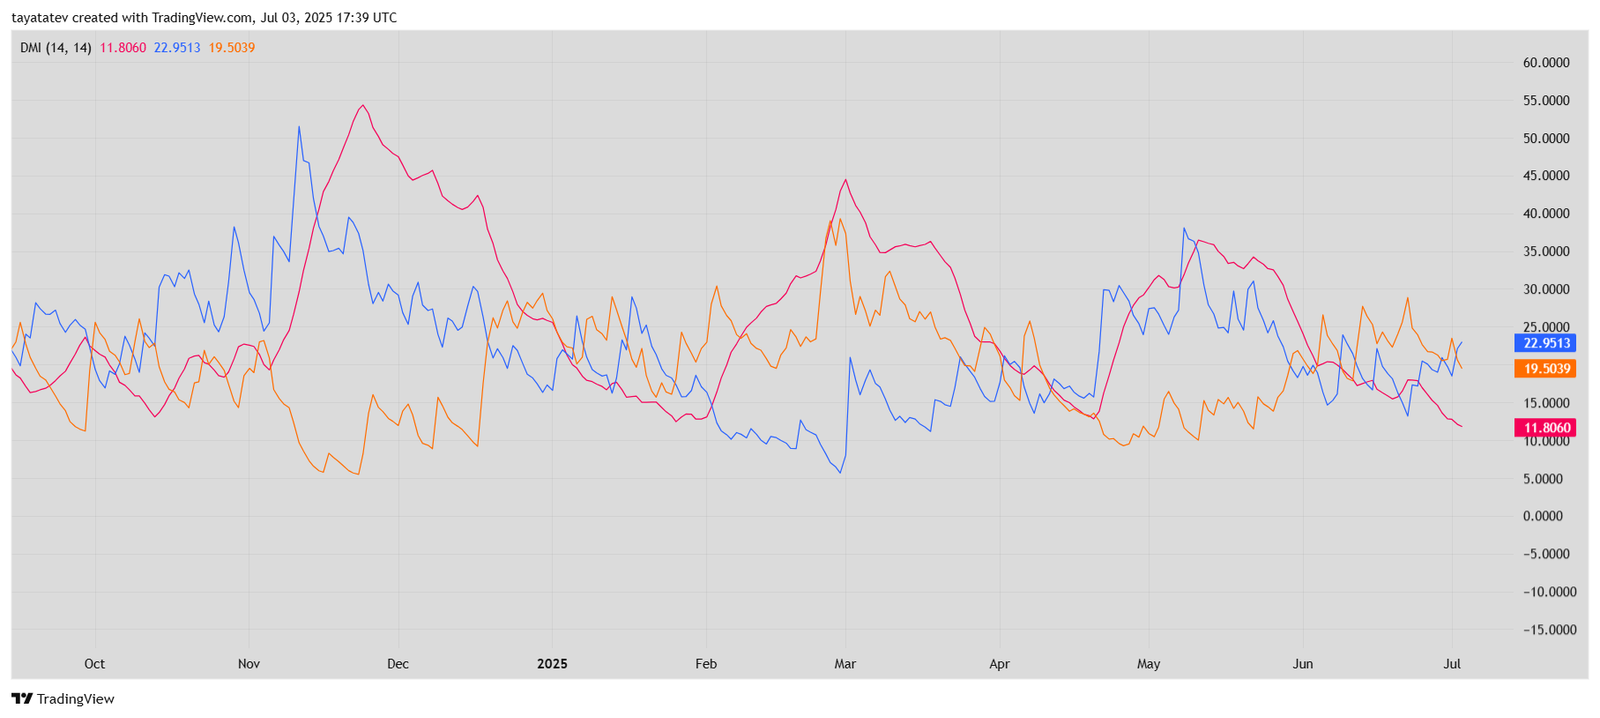
However, the ADX value remains below 20, which means the trend is still weak. For a strong directional move to begin, the ADX typically needs to rise above 25. Until then, the market may remain range-bound with modest upward momentum.
If the ADX starts to rise while the blue line stays above the orange, that would confirm a strengthening bullish trend.
Bitcoin MACD Chart Flashes Bullish Crossover After June Correction
This MACD (Moving Average Convergence Divergence) chart, created on July 3, 2025, shows Bitcoin forming a bullish momentum signal following weeks of downward pressure. The MACD indicator consists of two lines:
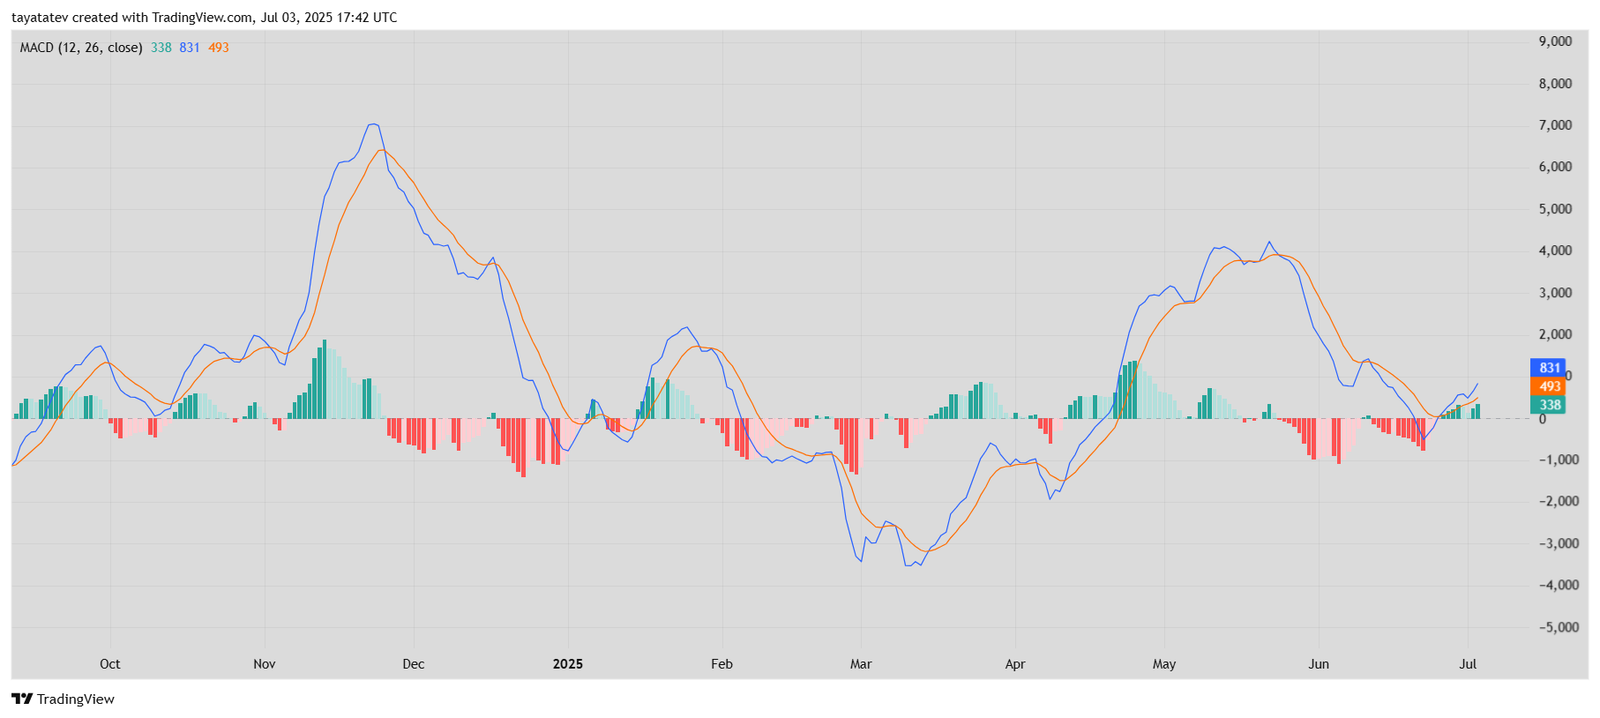
MACD line (blue): the difference between the 12-day and 26-day exponential moving averages (EMAs).
Signal line (orange): the 9-day EMA of the MACD line.
The histogram (bars) shows the gap between these two lines.
At the latest point, the MACD line has crossed above the signal line, which signals a bullish crossover. This pattern often indicates that the trend may shift upward.
In June, Bitcoin saw a MACD downtrend where the blue line stayed under the orange line, and the histogram remained negative. That has now changed. The histogram bars have turned green, and the MACD has moved back above zero, both of which support bullish continuation.
This setup aligns with other bullish indicators seen recently, including the breakout from a bullish flag pattern and a rising Relative Strength Index (RSI).
Bitcoin Price Chart (INR) Approaches ₹9.5M Resistance After Long-Term Accumulation
This Bitcoin chart, shown in Indian Rupees (INR) – BTC/NTR, illustrates the asset’s strong upward trajectory over time. The price is now approaching ₹9.5 million, a level that has historically acted as resistance.
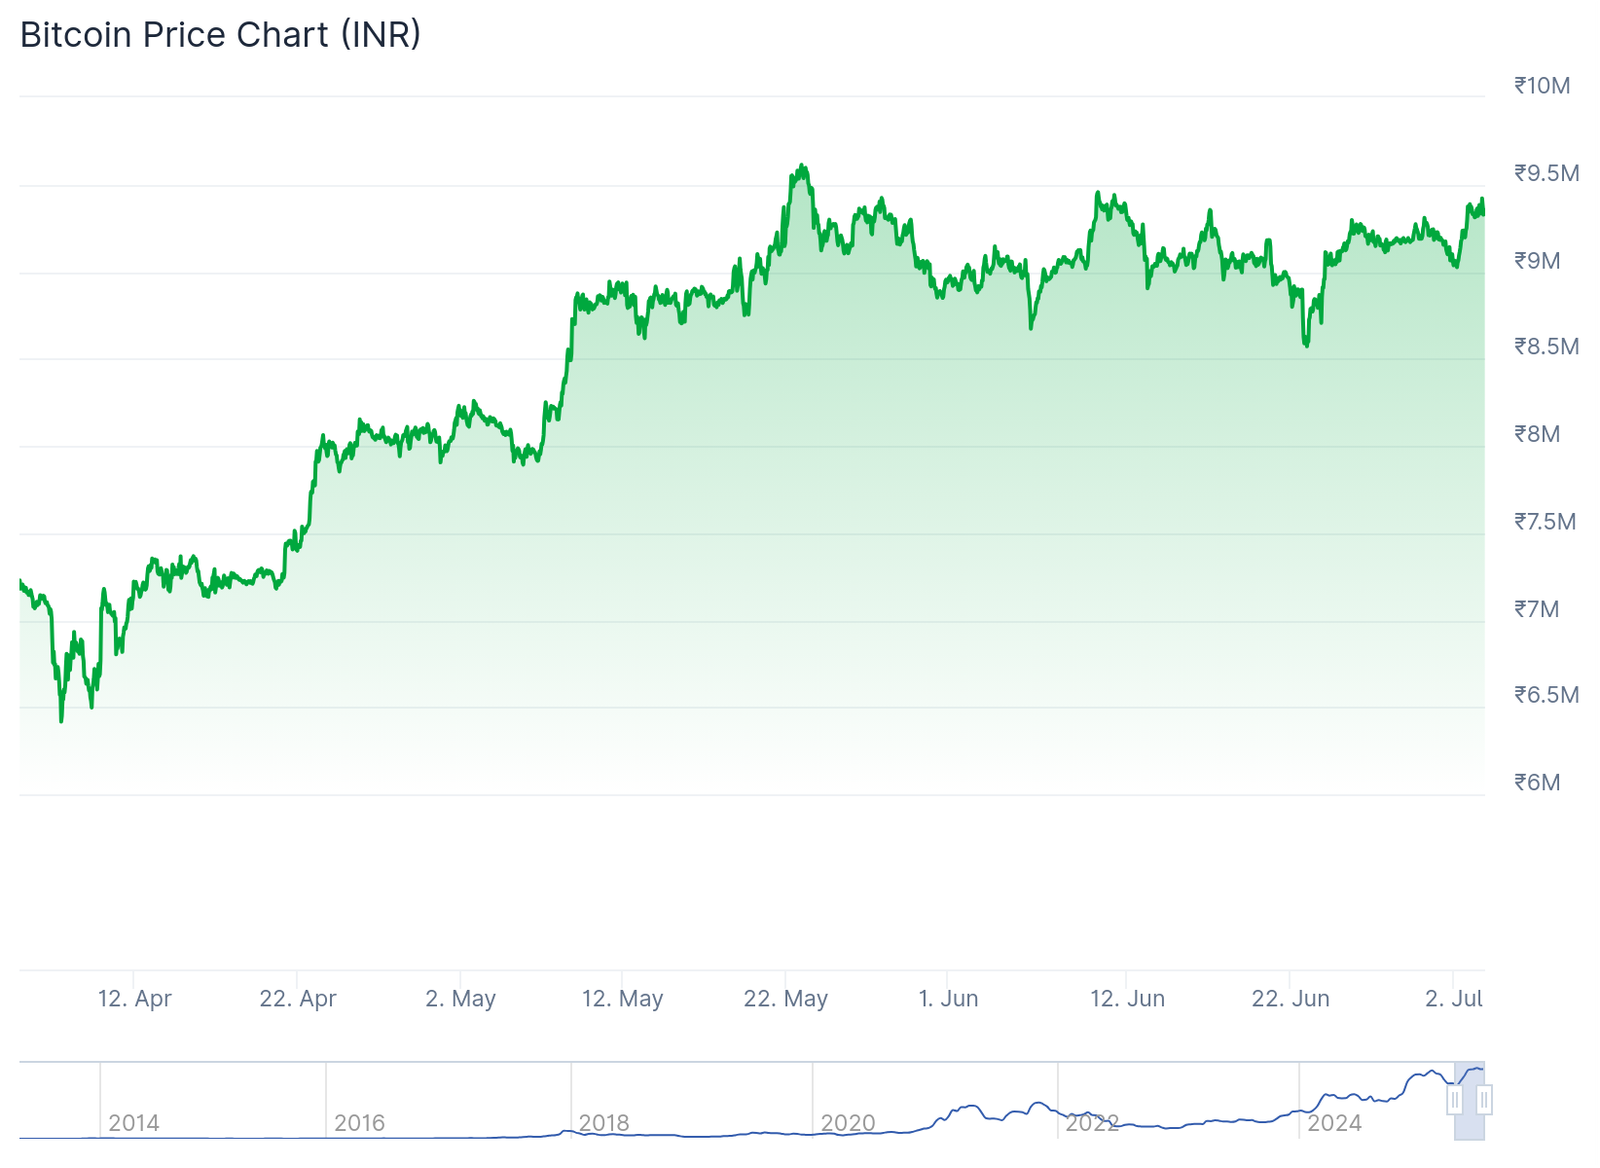
From the bottom of the chart, Bitcoin recovered sharply after a dip around the ₹6M–₹6.5M zone, which occurred in early April. Since then, the price has steadily climbed with minimal corrections, forming a sequence of higher lows and higher highs.
Throughout May and June, Bitcoin consolidated in a wide range between ₹8.5M and ₹9.5M. Despite several attempts, it failed to break above ₹9.5M with strong conviction—suggesting the area is a major resistance zone.
Now, in early July, Bitcoin is once again testing this ₹9.5M ceiling. The consistent pattern of recovery and sideways action below this level indicates accumulation—a phase where traders buy gradually before a possible breakout.
If Bitcoin crosses ₹9.5M with volume and holds, the next leg could take it toward the psychological ₹10M mark. However, failure to break through could lead to another retest of ₹9M or even lower support levels.
