
Bitcoin price broke above $105,900 on June 2, but failed to hold on to the price level. The token’s fall from grace began after BTC price could not reclaim its recent peak above $110,000. The asset has struggled to regain upward momentum despite holding above key technical thresholds in the past week. Since May 20, BTC has remained trapped within a narrowing band, flashing signs of weakening buying interest as trading volumes declined.
Market participants are watching the $106,000 mark closely. Analyst Michaël van de Poppe pointed to $106,000 as the key level to watch. He suggested a breakout above that threshold could trigger a strong bullish continuation. So far, however, Bitcoin has failed to generate enough volume or conviction to push past that resistance.

The broader macro environment remains tense. Risk assets continue to trade cautiously as investors weigh U.S. economic data, Treasury yields, and rate cut expectations. Meanwhile, altcoin volumes have thinned out, and capital rotation into higher beta assets has stalled, leaving Bitcoin as the dominant driver of sentiment across crypto markets.
Despite resilience in spot price, derivatives positioning remains neutral. Open interest across major exchanges has plateaued, and funding rates show little sign of directional conviction. The lack of leverage-driven momentum highlights a broader shift in market behavior—one driven increasingly by wallet activity and exchange flows rather than speculative exuberance.
Amid this, on-chain data has revealed conflicting trends between long-term accumulation and short-term distribution, especially among miners and whales.
On-Chain Metrics Show Mixed Signals as Whale Activity Intensifies
The loss of BTC price momentum came as key on-chain metrics show early signs of structural shifts among major holders. After weeks of relative strength, Bitcoin’s inability to break higher has fueled uncertainty across markets already on edge from macro headwinds and declining altcoin flows.
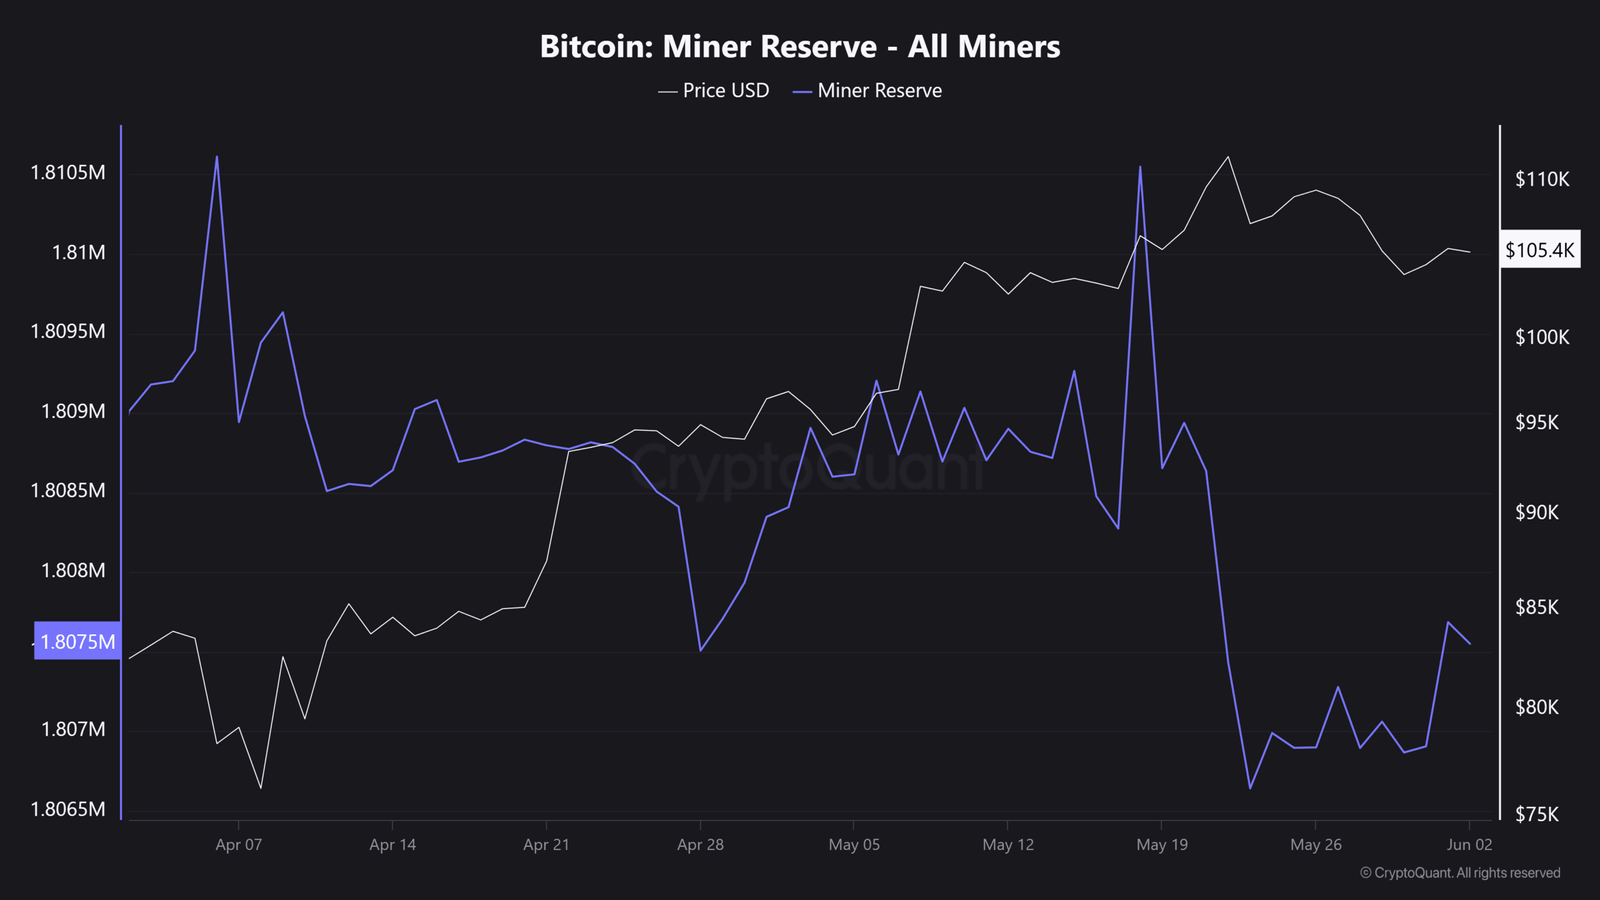
Bitcoin’s miner reserves dropped sharply from above 1.809 million BTC to 1.8075 million BTC in late May, indicating accelerated distribution by mining entities. The decline coincided with a pullback in BTC price from $110,000 to around $105,400, highlighting mounting sell pressure from core supply sources.

Meanwhile, exchange netflows remained predominantly negative, with multiple daily outflows exceeding 6,000 BTC throughout May. This trend signals consistent accumulation by long-term holders or institutional entities moving funds off centralized platforms. However, a brief inflow spike near May 20 suggests episodic short-term sell positioning.
The exchange whale ratio has surged to 0.74, its highest level in months, confirming that a growing share of deposits on exchanges originate from large wallets. Elevated whale ratios often precede price corrections, particularly when paired with weakening miner reserves.
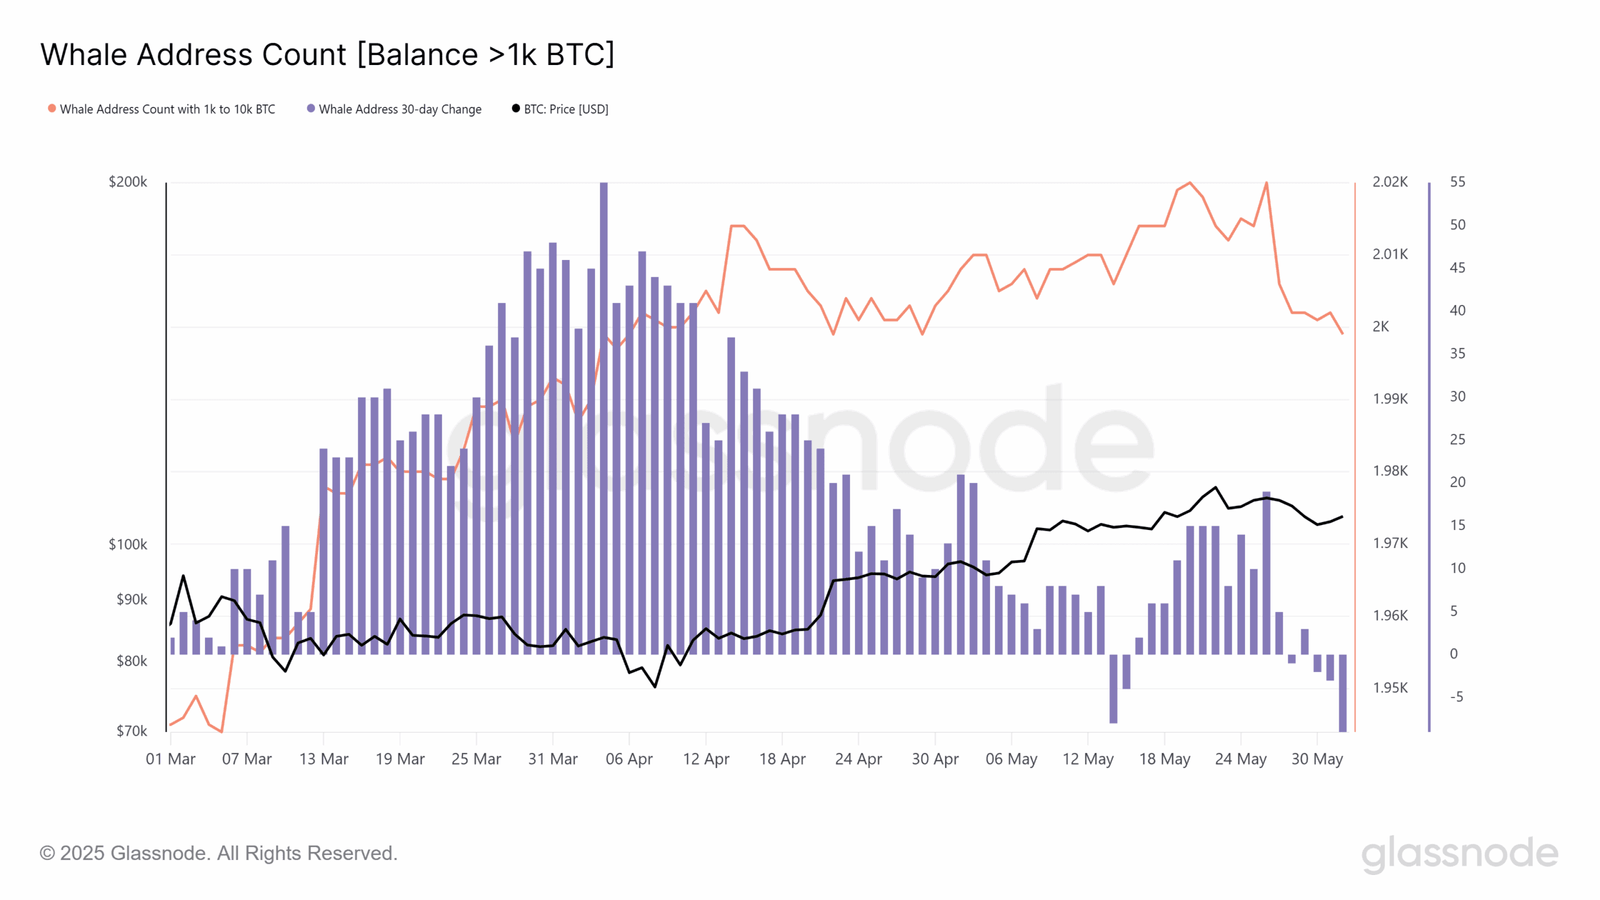
Adding to the complexity, Glassnode data shows a steady decline in addresses holding over 1,000 BTC. The whale address count dropped from over 2,020 in mid-May to just above 2,000, accompanied by persistent 30-day net losses. This suggests redistribution or profit-taking, potentially via over-the-counter channels or custodial rebalancing.
The combination of declining miner reserves, rising whale exchange ratios, and shrinking large address counts paints a cautionary near-term picture for the prime crypto. While strong net outflows support the long-term bull case, the concentration of sell-side indicators among major holders raises the risk of short-term drawdowns.
As such, it seems Van de Poppe might have to wait for some time before Bitcoin price reclaims the $106,000 price mark.
Bitcoin Price Struggles As Bears Defend Key Resistance
Bitcoin’s price action remains capped by the 20-day EMA, which has acted as a strong dynamic barrier over the past several sessions. The repeated failure to close above this moving average reflects persistent bearish pressure and short-term market indecision. As of June 2, the price pulled back to $104,087, down 1.53% on the day.
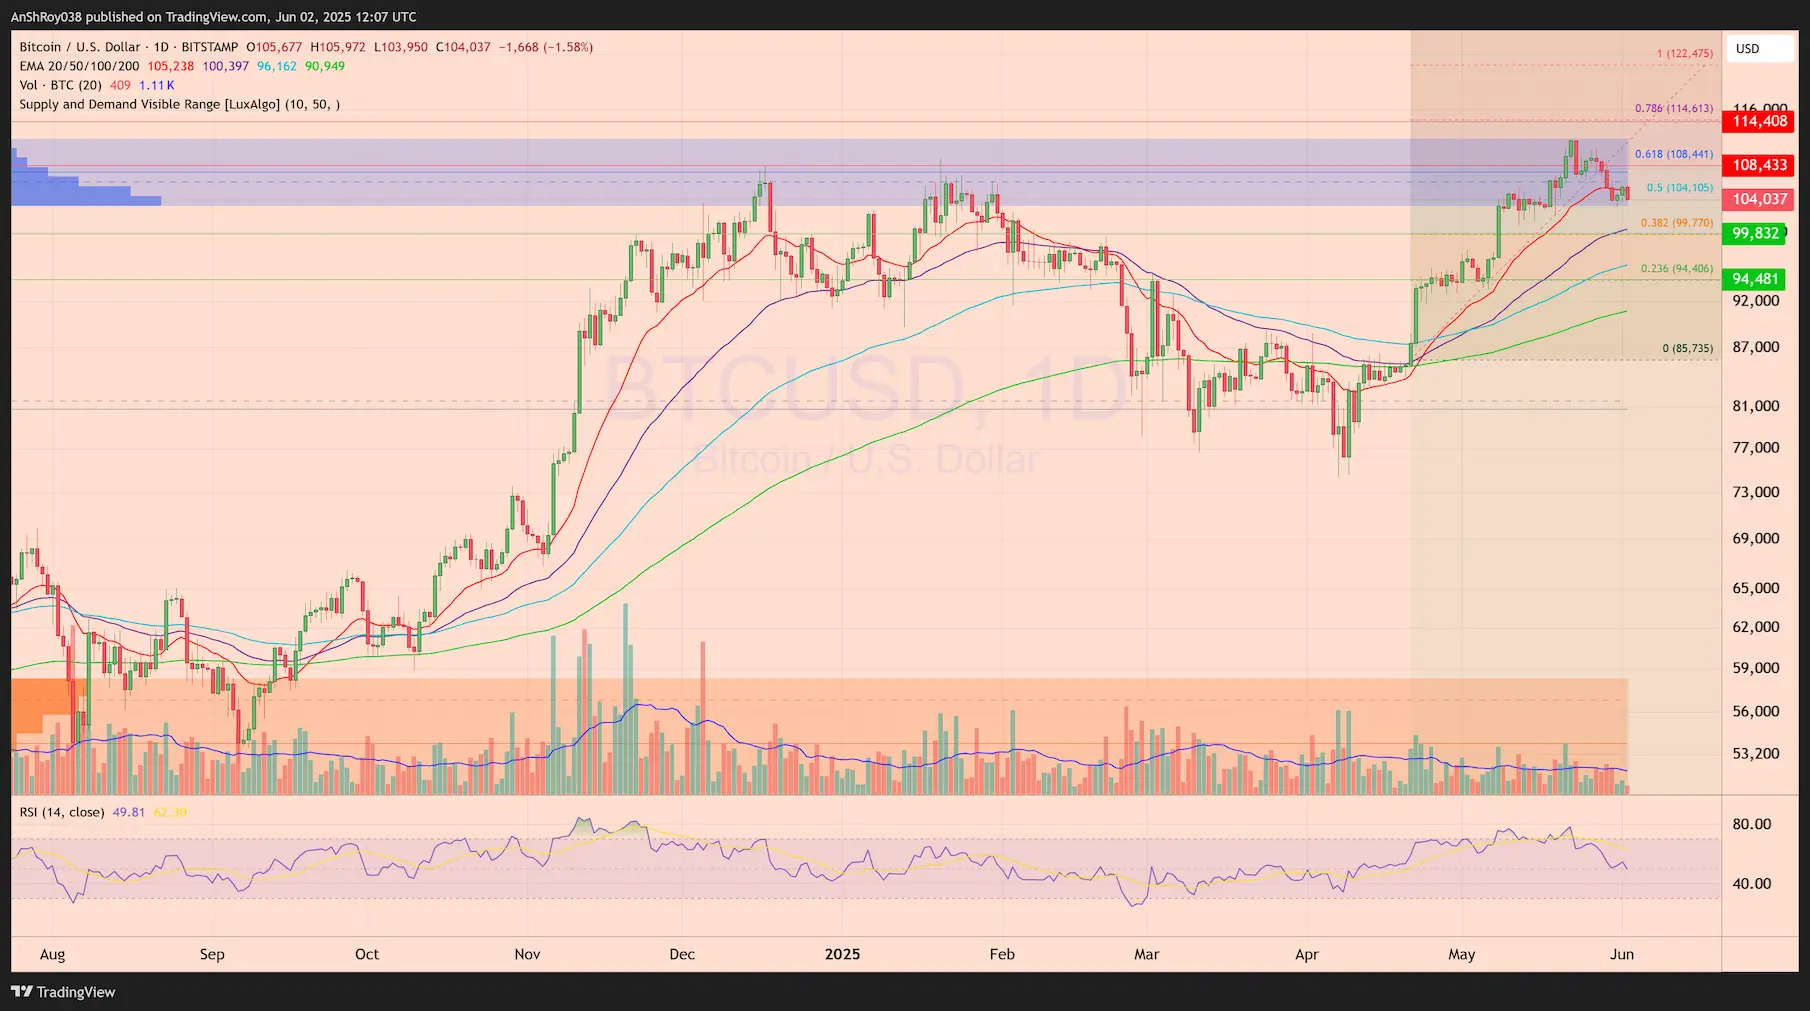
The immediate upside hurdle sits near $108,400, a horizontal resistance level that aligns with earlier rejection points from May. A decisive move above this level would be necessary to invalidate the short-term bearish structure and re-establish bullish momentum. If bulls manage to flip this resistance, the next key target lies near $114,400—a critical level marked by previous swing highs and supply concentration. However, until this level is reclaimed, the broader structure remains vulnerable to downside continuation.
On the downside, Bitcoin holds interim support near $99,830. This zone also coincides with the 50-day EMA (purple wave), reinforcing its significance as a short-term defense. A breakdown below this threshold would likely accelerate bearish momentum, opening the door for a test of the lower support near $94,500. This level marks the last major support before BTC risks re-entering the broader consolidation zone from early Q2 2025.
The RSI has dropped below 50, suggesting a momentum shift in favor of the bears. Combined with weakening volume and rejection from dynamic resistance, the setup favors caution. Bulls must reclaim $108,400 quickly to avoid deeper retracement scenarios. Until then, the path of least resistance appears skewed to the downside.
