
A long-time Bitcoin holder has shifted strategy, unloading thousands of BTC and redirecting the capital into Ethereum. On-chain data shows the whale sold 2,970 BTC worth $337 million over the past two days. Instead of holding cash, the address aggressively moved into Ethereum, positioning both in derivatives and spot markets.

The whale opened 135,265 ETH in long positions valued at $577 million. Trading records reveal leveraged bets across multiple entries, with exposures ranging from 6x to 10x leverage. The open contracts show liquidations set between $3,511 and $3,611, while unrealized losses already exceed $3 million per position.
In addition to futures, the address also bought 50,472 ETH worth $215 million on spot markets. These purchases took place within a short window, highlighting a concentrated accumulation strategy.
The combination of heavy BTC selling, aggressive ETH longs, and large spot buys marks one of the largest recent rotations between the two assets. The move underscores growing whale activity around Ethereum, even as short-term funding costs and unrealized losses weigh on positions.
Ethereum Forms Bullish Flag Pattern Ahead of Potential Breakout
On August 22, 2025, Ethereum’s 4-hour chart against the U.S. dollar ETH/USD showed the creation of a bullish flag pattern. A bullish flag is a continuation pattern that appears after a strong upward rally, followed by a period of consolidation marked by downward-sloping parallel trendlines. It typically signals that once consolidation ends, the price may resume its upward move with momentum.
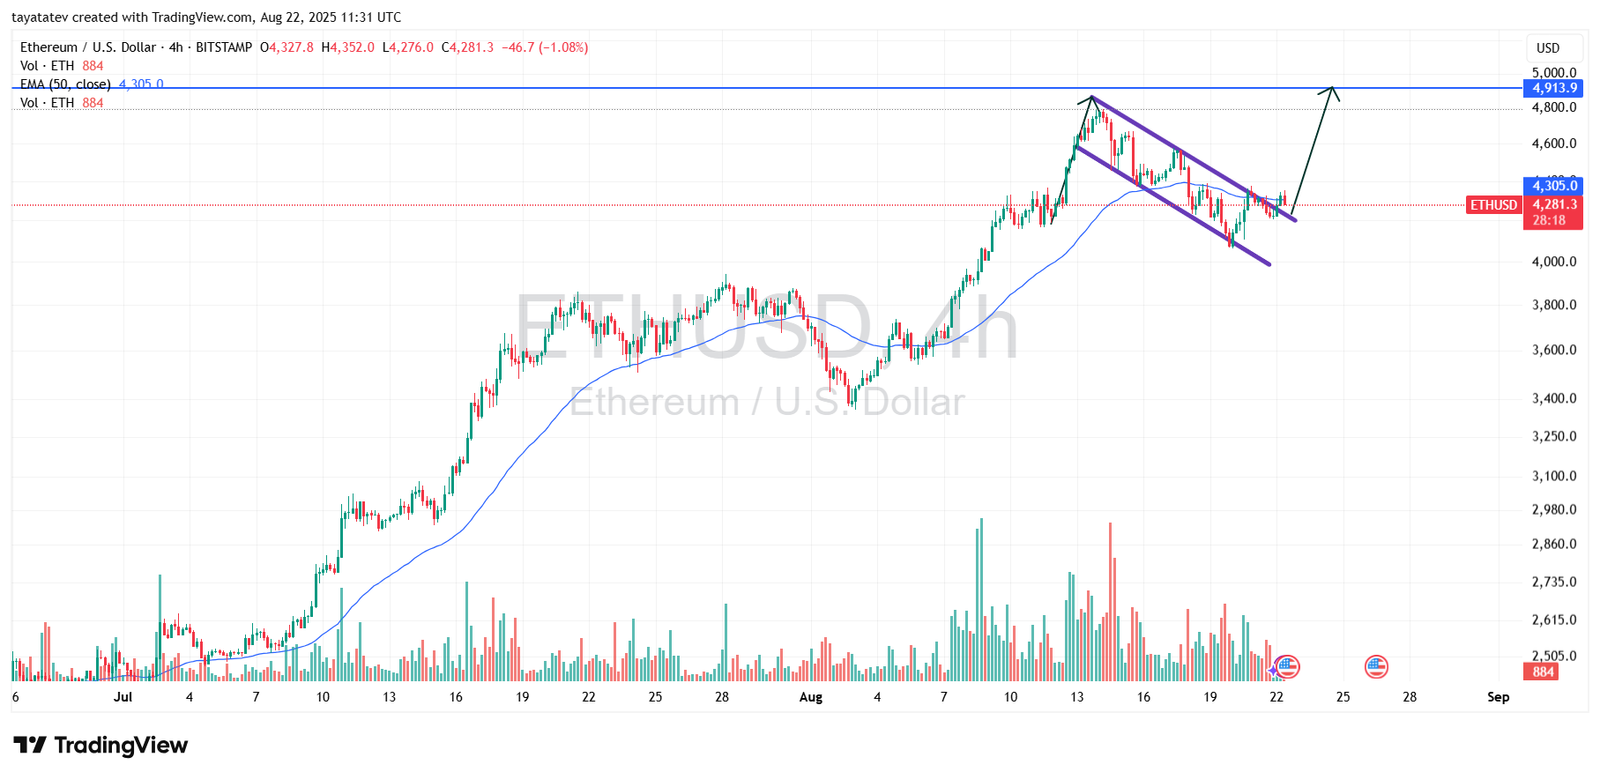
Ethereum rallied to a local high near $4,913 before pulling back inside the flag formation. The price has now broken above the upper boundary of this pattern, while trading around $4,281 at press time. If the breakout confirms, the bullish flag projects a measured move of about 14 percent from the current level, which would push ETH toward the $4,880 to $4,900 range, close to the previous resistance zone near $5,000.
The 50-period exponential moving average (EMA) at $4,305 is serving as an important support level, aligning with the breakout zone. Trading volumes have also picked up during the upward push, which strengthens the case for continuation. However, any rejection around the $4,300–$4,350 area could keep Ethereum consolidating longer before attempting another rally.
Ethereum RSI Signals Neutral Momentum
On August 22, 2025, Ethereum’s Relative Strength Index (RSI) on the 4-hour chart printed 48.89, with the moving average at 47.59. The RSI is a momentum oscillator that measures the speed and change of price movements, ranging between 0 and 100. Readings above 70 generally indicate overbought conditions, while levels below 30 signal oversold zones.
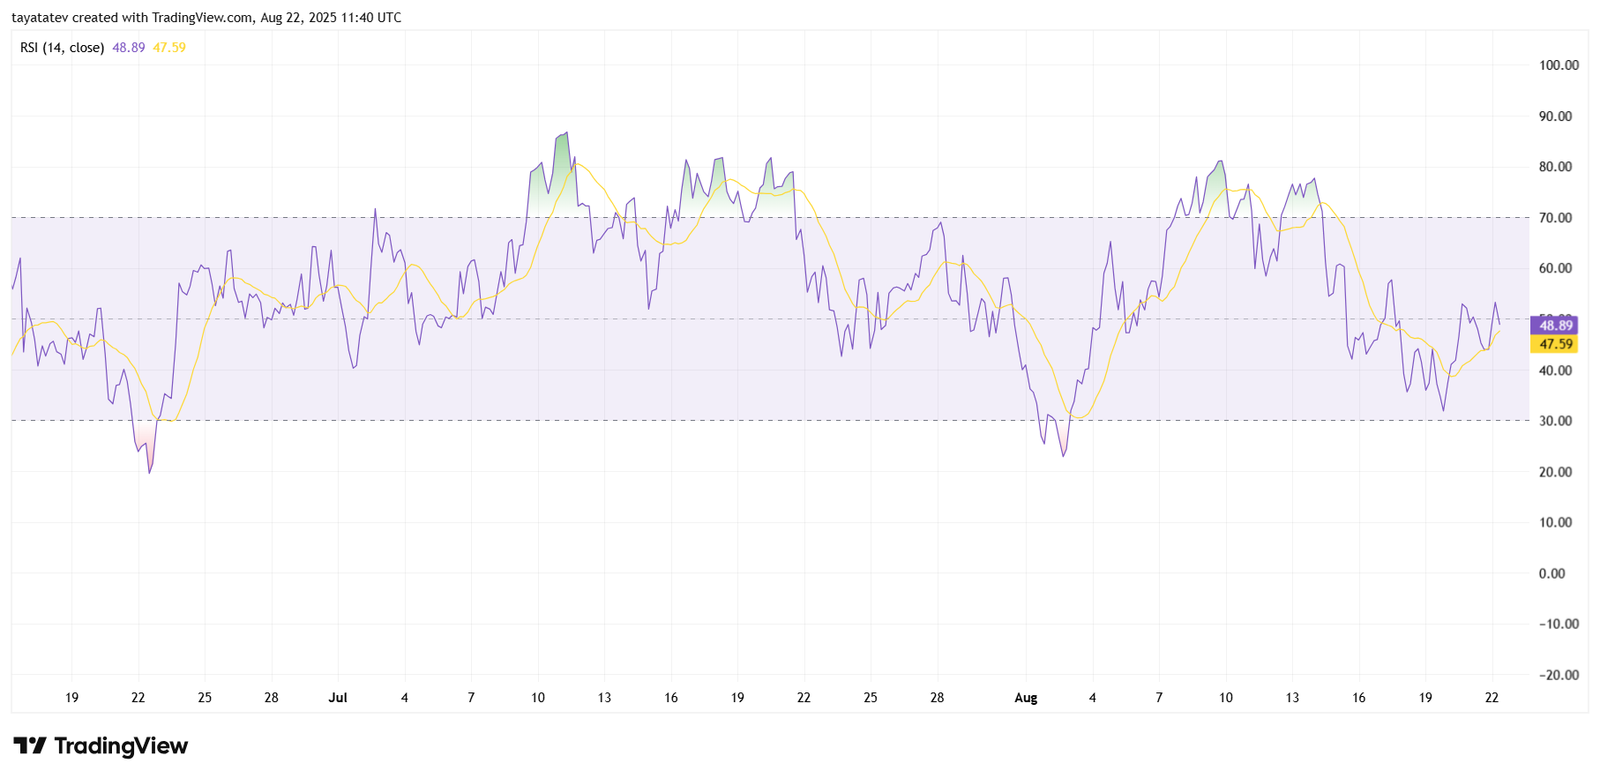
Ethereum’s current RSI sits near the midpoint, showing that the market is in a neutral phase without strong bullish or bearish dominance. After recovering from an early August dip that pushed RSI close to oversold territory, ETH has stabilized, oscillating between 40 and 60. This range suggests consolidation before a decisive move.
The RSI also crossed above its moving average, hinting at a slight shift toward bullish momentum. If this strength continues alongside the recent bullish flag breakout, ETH could gain momentum and retest higher resistance levels. However, failure to push the RSI above 60 may signal extended sideways action, keeping ETH bound between its support and resistance zones.
Ethereum MACD Suggests Recovery Momentum
On August 22, 2025, Ethereum’s MACD (Moving Average Convergence Divergence) on the 4-hour chart indicated signs of recovery momentum. The MACD line (blue) crossed above the signal line (orange) after a prolonged period of bearish histogram bars, which had kept the indicator below the zero line. This crossover often signals the start of a potential bullish phase when supported by volume.
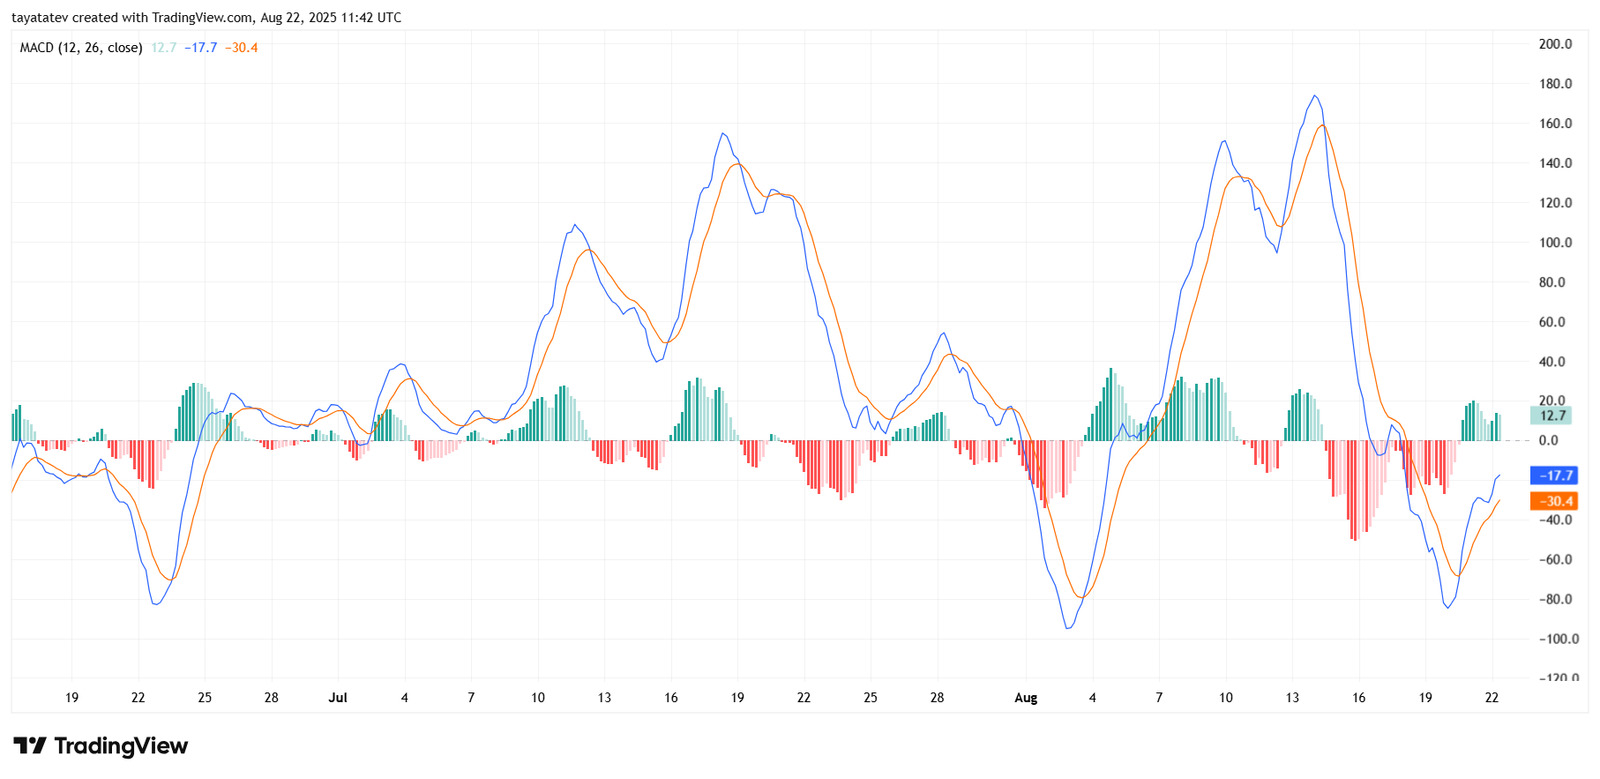
At present, the MACD line stands at -17.7, while the signal line is at -30.4, with the histogram showing +12.7. The shift into positive histogram territory highlights growing buying pressure. This change follows Ethereum’s bounce from the recent correction, where the MACD had bottomed near -100, reflecting oversold conditions.
If momentum continues, the MACD could move closer to the zero baseline, strengthening the case for a trend reversal. This aligns with the breakout from the bullish flag formation on the price chart, reinforcing the probability of Ethereum attempting a move toward the $4,880–$5,000 resistance zone. However, failure to sustain the crossover may leave ETH vulnerable to renewed weakness if sellers regain control.
Ethereum Bollinger Bands Indicate Tightening Price Action
On August 22, 2025, Ethereum’s 4-hour chart displayed signals from Bollinger Bands (BB 20, SMA, 2) that point to a tightening price range. The upper band sits at $4,386, the middle band at $4,243.9, and the lower band at $4,101.7. With ETH trading near $4,286, the price is consolidating just above the midline.
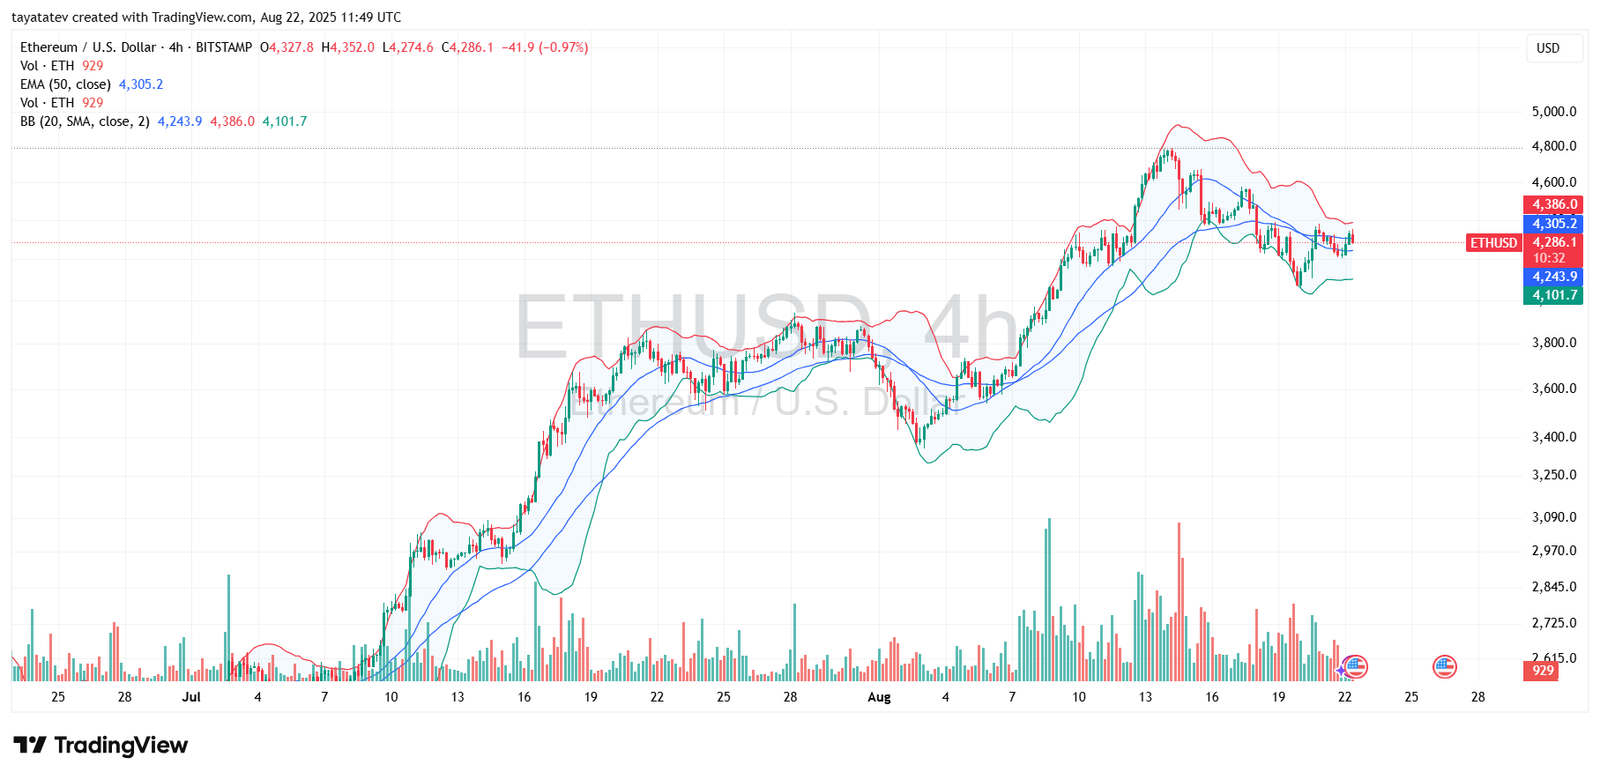
Bollinger Bands measure volatility by placing bands two standard deviations away from a 20-period simple moving average. When the bands narrow, it often signals reduced volatility and the potential for a sharp move in either direction once price breaks out. Ethereum’s bands have contracted compared to earlier in August, suggesting that a decisive move is approaching.
If Ethereum pushes above the upper band at $4,386, it would confirm a bullish breakout, opening the path toward retesting the $4,800–$5,000 resistance zone. Conversely, if ETH slips below the lower band at $4,101, it could trigger a retest of lower support near $4,000. The narrowing bands emphasize that Ethereum is entering a phase where volatility could quickly expand in the coming sessions.
