
NOIDA (CoinChapter.com)—Bittensor (TAO) price has been downtrend since Feb. 2025. Yet, the token remains the center of bullish speculation in early March 2025, with growing investor interest fueled by mostly positive community sentiment. Traders on X have pointed to potential accumulation opportunities, exchange balance shifts, and TAO’s expanding role in decentralized AI as indicators of long-term confidence.
Technical discussions have been particularly active, with traders highlighting both bullish and corrective phases. On March 6, @kwantxbt noted that TAO price was consolidating after a recent pump to $0.1820 with a nearly oversold RSI of 32, hinting at a potential reversal near $0.19.

Meanwhile, Ravi Rajapaksha labeled TAO price as being in a “best buy zone” at a key support level, encouraging investor accumulation.
On-chain data also supports the bullish argument, with TAO’s total exchange balance decreasing by 19,572 tokens daily to 1,535,143 by March 6, signaling investor withdrawals. A broader monthly reduction of 118,018 tokens further reinforces the narrative of long-term accumulation. However, a weekly inflow of 9,768 tokens suggests that some traders remain cautious.
While the market remains optimistic, TAO’s price action tells a different story. A descending triangle pattern has formed, creating a strong bearish setup that could counteract the bullish sentiment. Moreover, the wider market remains in turmoil, and waits for some bullish cues to come from President Trump’s crypto summit on March 7.
Descending Triangle Breakdown Puts Bears in Control
Despite the optimism in market sentiment, TAO’s technical structure remains bearish. The asset recently formed a descending triangle, a continuation pattern that typically signals further downside. A series of lower highs converging toward a flat horizontal support characterize the pattern, indicating weakening bullish momentum. As selling pressure increases, a breakdown below support usually leads to a sharp decline, often equal to the triangle’s height.
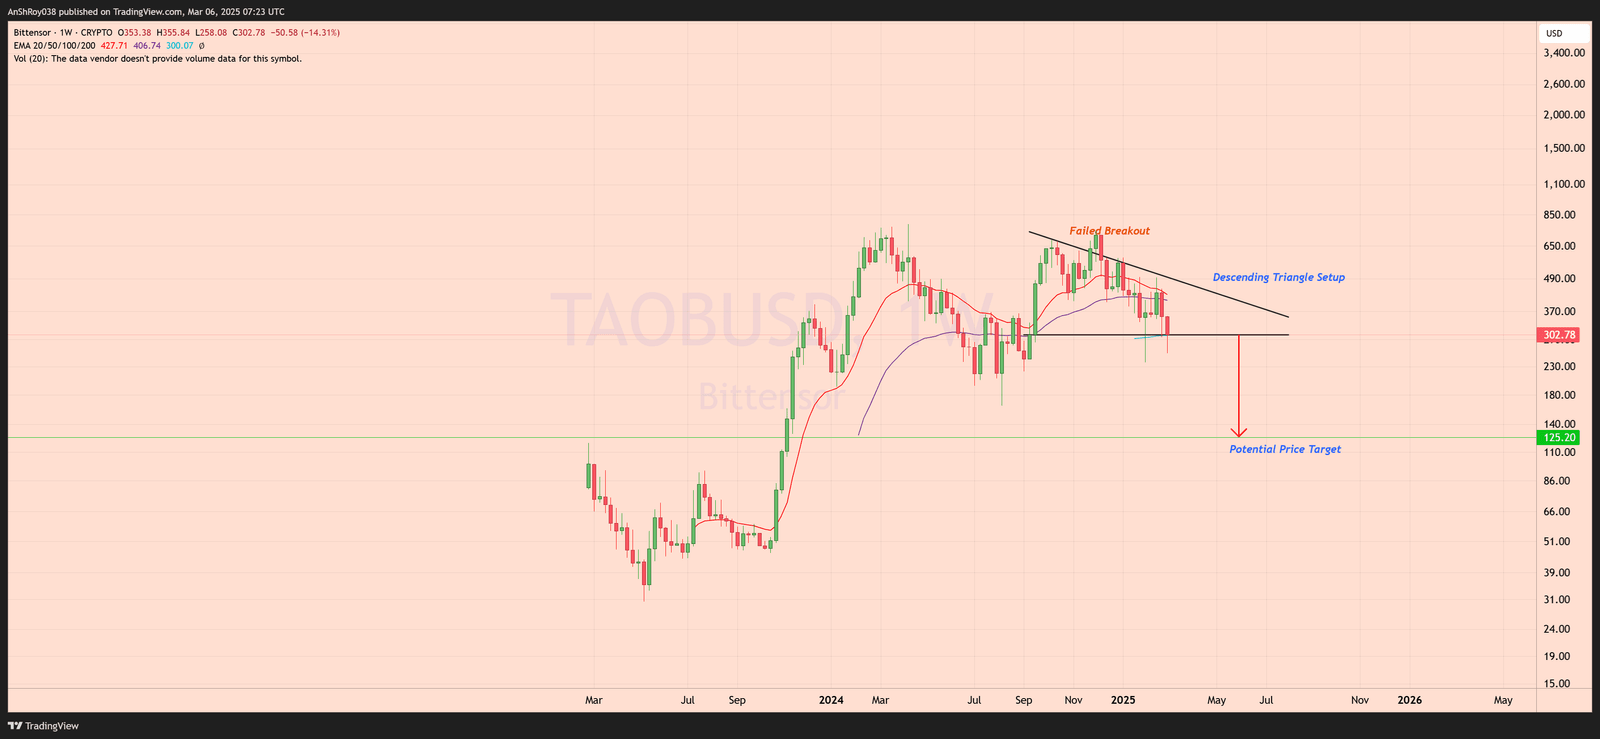
TAO attempted a breakout above the descending trendline but failed, triggering a strong rejection reinforcing bearish control. The TAO price has since lost its key horizontal support, confirming the bearish breakdown. The 50-week and 100-week EMAs continue sloping downward, suggesting sustained selling momentum. This setup indicates that bears remain in control, with price action consistently forming lower highs and lower lows over the past several weeks.
To calculate the potential price target from the descending triangle, traders measure the pattern’s height from the highest point of the triangle to the horizontal support level. This height is then subtracted from the breakdown point, giving an estimated downside target. Applying this method to TAO’s breakdown, the projected price target falls near $125, nearly 59% from current levels.
A sustained move above the weekly EMAs would help invalidate the bearish setup. However, as long as TAO remains below the breakdown point, the dominant trend favors further downside.
TAO Faces Key Price Levels as Bears Maintain Pressure
TAO’s latest price action highlights the growing influence of bearish momentum. The asset is trading near $302, struggling to hold above the 0.5 Fibonacci retracement level at $302. This level remains a key inflection point, as a sustained failure to hold above it could accelerate losses.
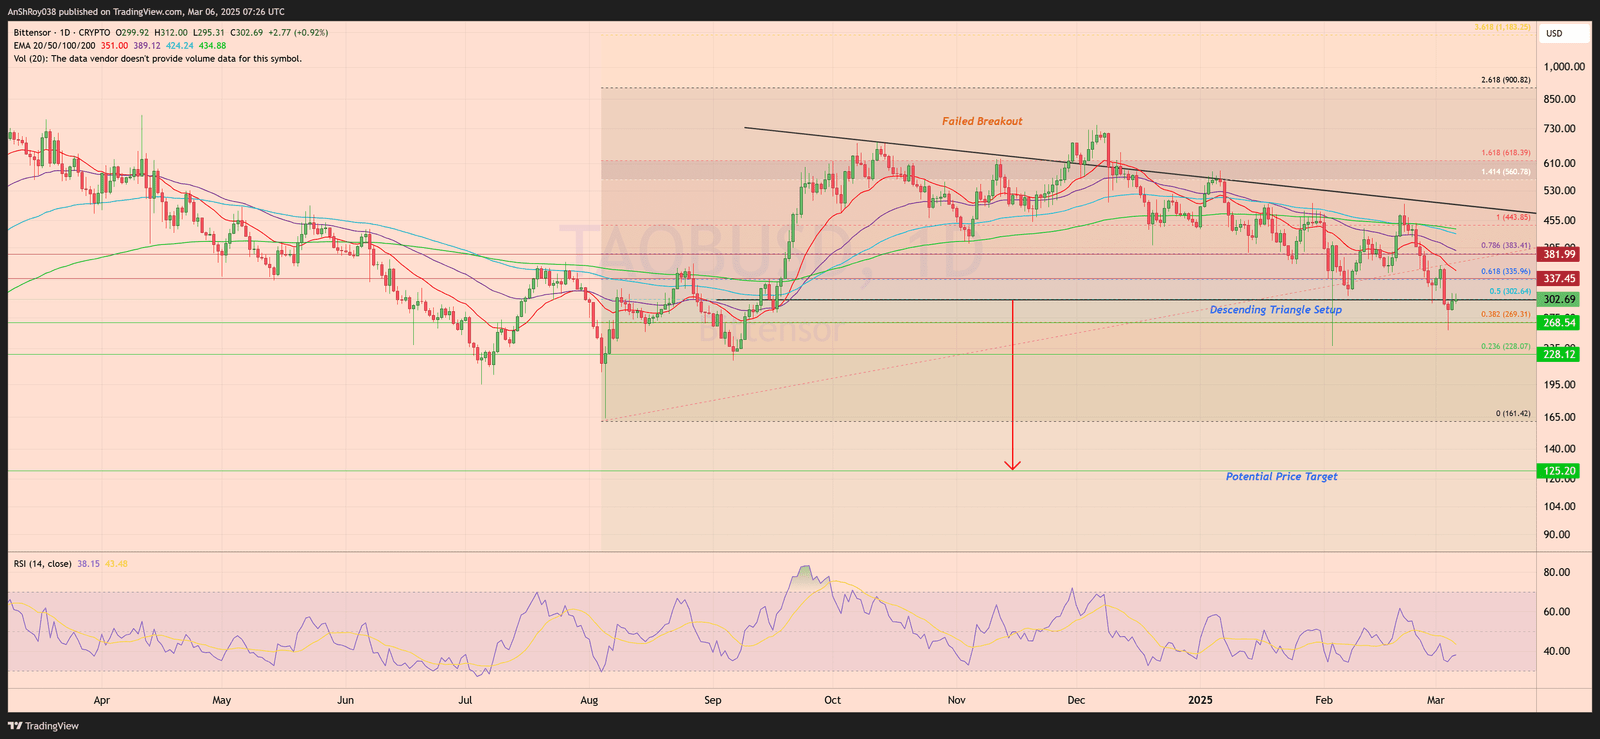
The 50-day and 100-day EMAs are positioned above the current price, confirming strong resistance in the $337-$381 range. Additionally, the 200-day EMA, located near $434, remains a crucial long-term barrier. TAO’s failure to reclaim these levels suggests that any relief rally could be short-lived.
On the downside, a confirmed rejection from $337 would likely push TAO toward $268, with $228 as the next support. If selling pressure intensifies, the previously mentioned $125 target comes into play. Meanwhile, the Relative Strength Index (RSI) at 38 indicates TAO price is near the oversold region, but weak buying momentum suggests that a prolonged decline remains possible.
To reverse the trend, TAO must first establish a firm foothold above $337 and reclaim key moving averages. Until then, the bearish structure remains intact, with downside risks outweighing bullish hopes.
