
Institutional investors are shifting capital away from Cardano (ADA) and into Remittix (RTX), a rising payment-focused token. Frustration over Cardano’s long-standing delays in scaling and regulatory concerns has fueled the exodus. In contrast, Remittix has positioned itself as a practical alternative with low cross-currency fees, a locked whale staking model, and real-world remittance tools.
By mid-August 2025, Remittix had locked 10% of its total supply in whale-controlled staking contracts, creating long-term scarcity. At the same time, Cardano has struggled to maintain institutional confidence amid limited on-chain activity and slow protocol upgrades. The disparity in perceived utility has become a key driver of capital reallocation.
Real-World Demand Pushes Remittix Ahead
Remittix’s design focuses on low-fee remittances and fast settlement. Users pay just 0.1% per transaction across currencies. These features have resonated with migrant workers, freelancers, and global SMEs—groups Cardano has not yet managed to reach at scale.
So far, Remittix has raised $21.4 million in its presale and sold over 620 million tokens. Its payment wallet is scheduled to launch in beta by mid-September. BitMart already confirmed a listing, adding further legitimacy to the token. Meanwhile, Cardano’s usage growth has stagnated.
ADA Confirms Bullish Flag Pattern, Eyes 34% Upside Toward $1.149
Cardano ADA/USDT is forming a bullish flag pattern on the 4‑hour chart, suggesting a potential continuation of its recent uptrend. A bullish flag typically forms after a strong upward move, followed by a downward-sloping consolidation that remains within parallel lines. This pause often precedes another upward breakout of similar magnitude to the initial rally.
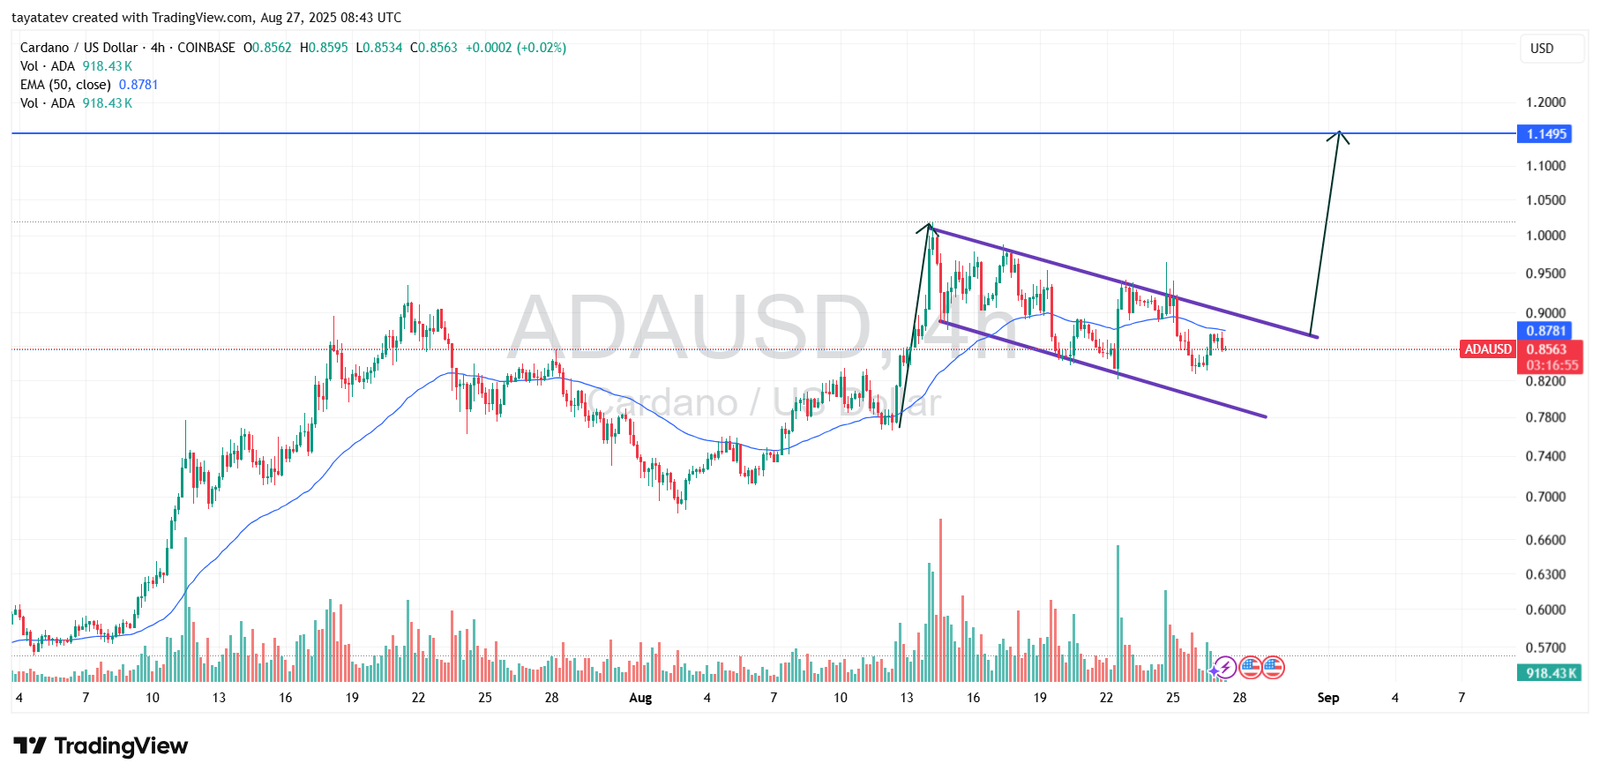
On this chart, ADA surged from approximately $0.70 to $0.96 between August 14 and 18, then entered a descending channel. This flag structure is clearly visible, marked by two parallel purple lines sloping downward. Now, ADA trades at around $0.856 and appears ready to test the upper boundary of this flag.
If confirmed, the breakout target would mirror the previous rally. The measured move from the bottom of the flag to the breakout zone projects a price target of $1.149, reflecting a 34% increase from current levels.
EMA and Volume Support the Breakout Setup
The 50-period Exponential Moving Average (EMA) stands at $0.878, just above ADA’s current price. The token has been oscillating around this EMA line throughout the flag formation, suggesting that the trend is not yet lost. A decisive move above both the EMA and the upper flag boundary would confirm the bullish breakout.
Volume remains consistent at 918.43K ADA, which supports the possibility of a strong move. In previous breakouts, ADA’s volume spiked sharply—something that traders may watch closely again. A volume surge on a close above the flag would signal real momentum behind the breakout.
As of now, ADA is hovering just below key resistance at the upper flag boundary. If bulls maintain pressure and break above the flag and the EMA together, a rally toward $1.149 could follow quickly.
RSI Shows Neutral Momentum as ADA Eyes Breakout
Cardano’s Relative Strength Index (RSI) on the 4‑hour chart sits at 44.56, with its moving average at 41.80, signaling weak momentum but no clear divergence. The RSI remains in the neutral zone, below the overbought threshold of 70 and above the oversold level of 30. This range suggests that ADA is neither overbought nor oversold, providing room for a possible upward move if momentum strengthens.
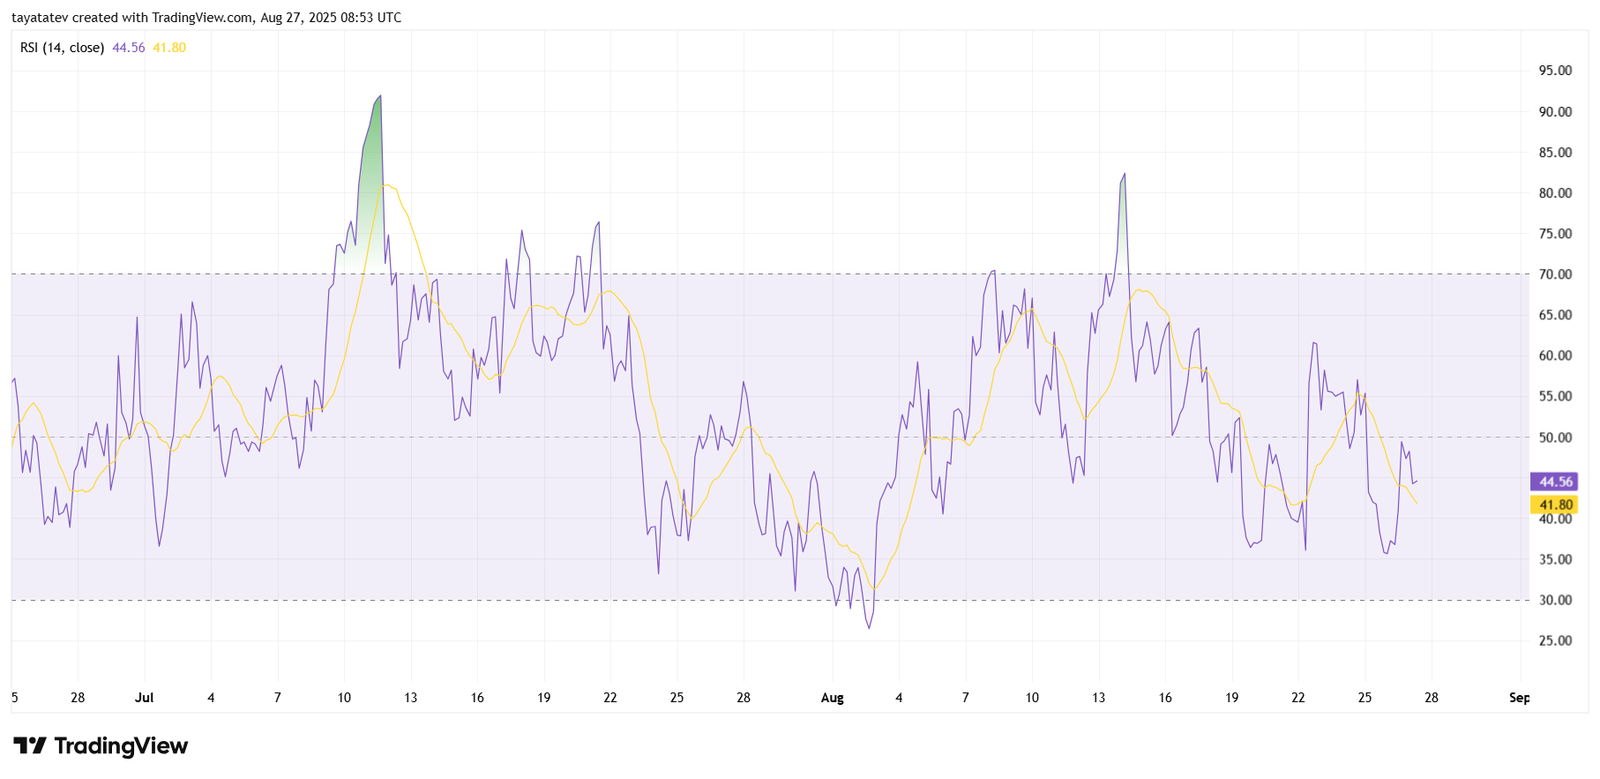
Earlier in July, the RSI peaked near 90 during ADA’s vertical rally, which coincided with the breakout from lower consolidation. Since then, momentum has cooled off. The RSI has failed to regain the 60–70 zone, despite multiple intraday rallies in August. Most notably, each attempt has met resistance around the 65 level, reflecting limited follow-through from buyers.
Currently, the RSI curve is sloping upward after a dip below 40 on August 25. This mild recovery hints at early bullish pressure. However, it remains below both the neutral 50 mark and its own average, suggesting that ADA still lacks strong conviction. For the bullish flag breakout to gain momentum, RSI must push decisively above 50 and retest the 60–65 zone.
In short, RSI does not yet confirm the breakout. But it also does not reject it. ADA holds enough space to move higher without facing immediate RSI-based resistance. If price breaks out of the flag and volume increases, RSI could follow upward—supporting the 34% upside target toward $1.149.
MACD Hints at Potential Crossover as Bullish Flag Holds
Cardano’s MACD (Moving Average Convergence Divergence) on the 4‑hour chart shows early signs of a possible bullish crossover. The MACD line (blue) is currently at –0.0094, while the signal line (orange) sits slightly higher at –0.0097. Although both remain below the zero line, the MACD histogram just turned green, printing a small positive bar at 0.0003, suggesting waning bearish pressure.
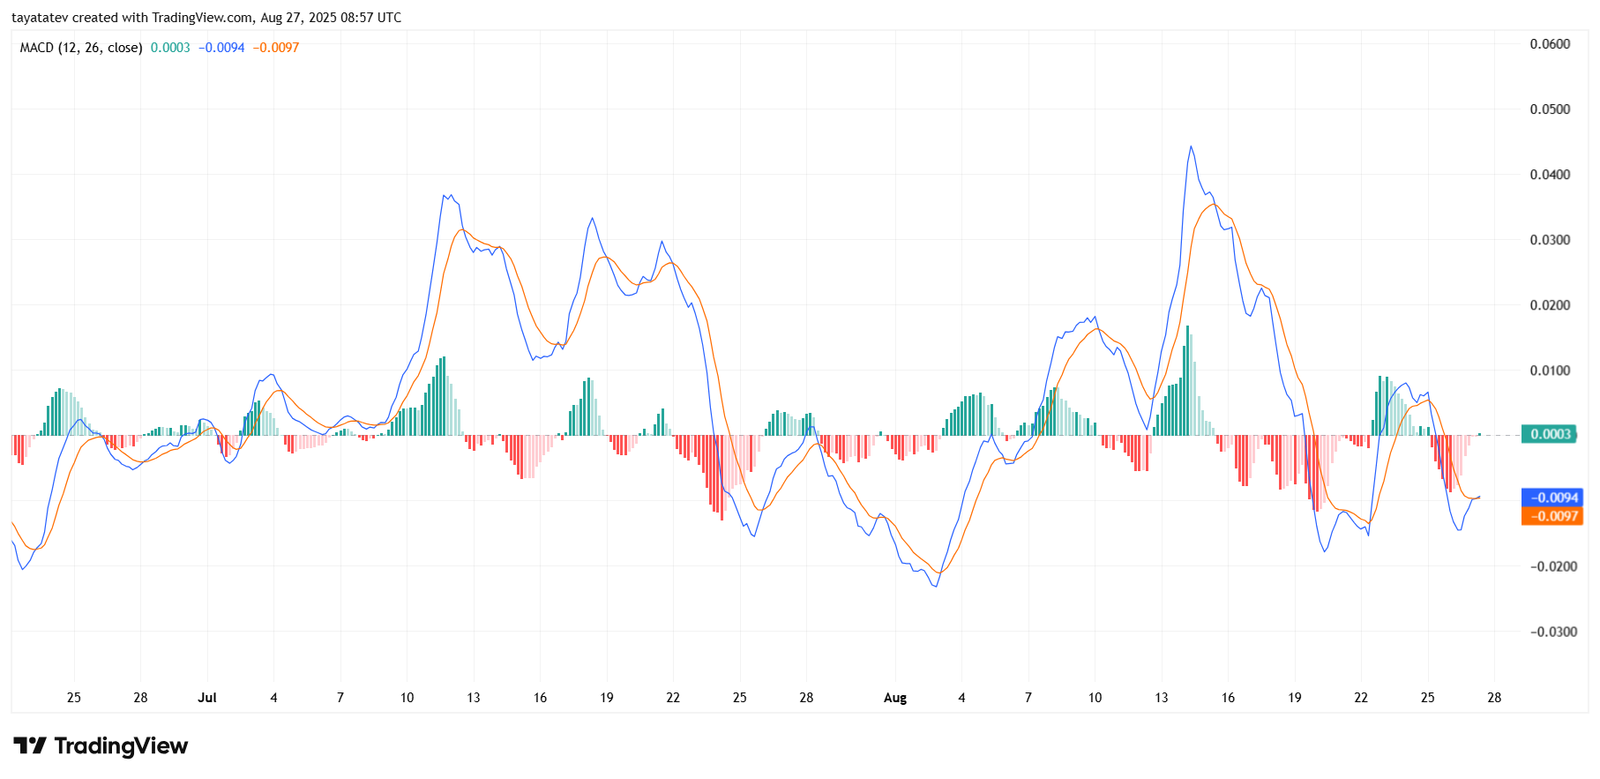
In recent weeks, ADA’s MACD has alternated between weak bullish and bearish phases. Every significant rally, including the sharp move in mid‑July and again in mid‑August, was preceded by a bullish MACD crossover below the zero line. A similar structure may be forming again, as the MACD line attempts to break above the signal line from below.
Notably, the histogram flipped green just as ADA tested the lower boundary of the bullish flag pattern. This alignment between MACD momentum and price structure adds weight to the breakout scenario. However, the current gap between MACD and the zero line remains wide, implying that momentum needs to strengthen further before a full confirmation.
For now, the MACD suggests neutral-to-bullish momentum. If a crossover occurs with the histogram expanding upward, it could support a breakout move toward the projected $1.149 target.
