
Cardano (ADA) continues to trade sideways near a critical long-term support zone. Historical data shows ADA often holds steady for months before sudden upward moves. Traders studying the daily chart believe this familiar pattern could shape ADA’s next direction if key levels hold.
ADA trades near $0.55 — down 27% this month. On the daily chart, the $0.51 level remains a solid support, aligning with the 0.786 Fibonacci retracement zone — an area where ADA has reversed in past cycles.
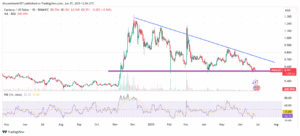
With Relative Strength Index (RSI) near 33, ADA appears technically oversold. However, the price continues to respect a descending trendline stretching back to late 2024. If buyers can force a clear breakout above this line, that would be the first sign of a shift in momentum. To see if this scenario could repeat, it helps to compare how ADA behaved during similar setups in its last cycle.
Historic Wyckoff Pattern Reappears on ADA Chart — Will it Trigger a Breakout?
Looking back, ADA consolidated for about six months from July to December 2020, then surged from around $0.30 to $1.50 — a gain of roughly 400% between January and February 2021. A similar double Wyckoff spring formation now appears near the same retracement zone, showing that buyers continue to defend this area.
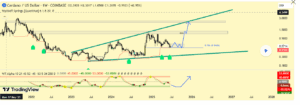
If this support stays firm, ADA could move sideways until October 2025 before attempting a larger breakout. Still, ADA price patterns alone do not move the market — so what are large holders doing during this phase?
Recent on-chain data shows mixed behavior. Wallets holding 10 million to 100 million ADA control about 16.2% of supply, slightly higher than before.
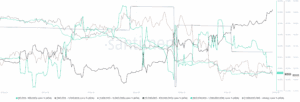
In contrast, smaller whale wallets with 1 million to 10 million ADA hold about 15.7%, while mid-sized addresses between 100,000 and 1 million ADA slipped to about 11.8%. This split hints that bigger players remain steady while mid-tier balances have eased. Whether this whale positioning can support another surge depends on whether Cardano’s network activity shows signs of recovery.
Cardano Transaction Volumes and Dev Activity Lag Behind Price Structure
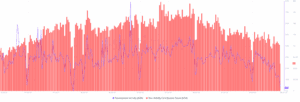
Daily transaction volume sits around 167 million ADA — down about 97% from its December 2024 peak near 7 billion ADA. MVRV ratios hover near 23% on the 2-year view, showing mild paper profits for longer-term holders. Meanwhile, Cardano’s development activity has slowed, with fewer active contributors than six months ago. Without stronger user or developer momentum, rallies often fail to sustain. To check if traders are betting on a move anyway, it helps to look at the derivatives market.
Current derivatives data shows traders remain cautious. Daily derivatives volume is about $892 million, while open interest sits near $719 million. The Binance ADA/USDT long/short ratio stands at 3.2, showing more long accounts, yet the overall market positioning stays balanced. This neutral stance suggests traders wait for stronger signals. Broader macro trends — especially Bitcoin’s market share — often decide when capital shifts from Bitcoin to altcoins like ADA.
Bitcoin Dominance May Guide Next Breakout
Bitcoin dominance (BTC.D) is near 65.8% — its highest this year — with its RSI at about 65.
Historically, when BTC dominance approaches overbought levels, capital sometimes rotates into large-cap altcoins if Bitcoin cools off. If BTC.D peaks soon, ADA and similar coins could benefit — but for now, Cardano still needs a clean trendline break and stronger on-chain momentum, leaving the question open: will ADA repeat its old pattern again?
So, will ADA repeat its pattern? If $0.51 support holds, larger holders stay steady, and Bitcoin dominance softens, ADA could follow its past cycle: an extended sideways phase before a sharp move higher. For now, the chart shows that ADA remains trapped in its range until clear signals — price, network use, and broader market rotation — align again.
