
Cardano (ADA) has formed a triple bottom pattern near $0.50, signaling a possible trend reversal. Analyst InvestingHaven highlighted the pattern on X, calling the $0.50 level a major support zone.
The triple bottom has emerged after several retests of this long-term support level. It indicates strong buyer demand and weakening seller momentum. This structure typically leads to an upward breakout if the trend holds.
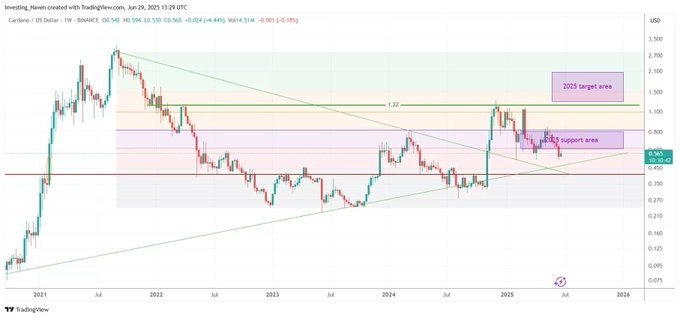
According to InvestingHaven, ADA’s price action remains constructive as long as its multi-week trendline holds. He added that a breakout above the $0.81 Fibonacci retracement level would mark a shift toward a new local high. This move could signal the beginning of a bullish cycle into 2025.
Despite the bullish setup, ADA dropped 3.5% over the last 24 hours. This decline has delayed a potential breakout from the falling channel.
Santiment Data Shows ADA Supply in Profit Surges Over 18 Billion
On-chain data from Santiment shows a significant rise in the ADA supply held in profit. As of Friday, July 4, 18.23 billion ADA are now profitable, up from 15.89 billion earlier in the week.
That’s a 2.34 billion increase in just a few days, aligning with Cardano’s 4.8% weekly recovery. The increase suggests growing optimism among holders as more ADA moves into profitable territory.
The metric tracks tokens last moved below the current market price. When the figure rises, it usually reflects bullish market behavior.
However, as ADA price recovers, some holders may begin to take profits. That could introduce short-term selling pressure and limit gains unless new buying demand absorbs the supply.
Cardano Price Forms Falling Wedge, Suggests 272% Rally Potential
Cardano ADA/USDT has formed a falling wedge pattern on the weekly chart. A falling wedge is a bullish chart pattern where two downward-sloping trendlines converge, signaling a potential breakout to the upside.
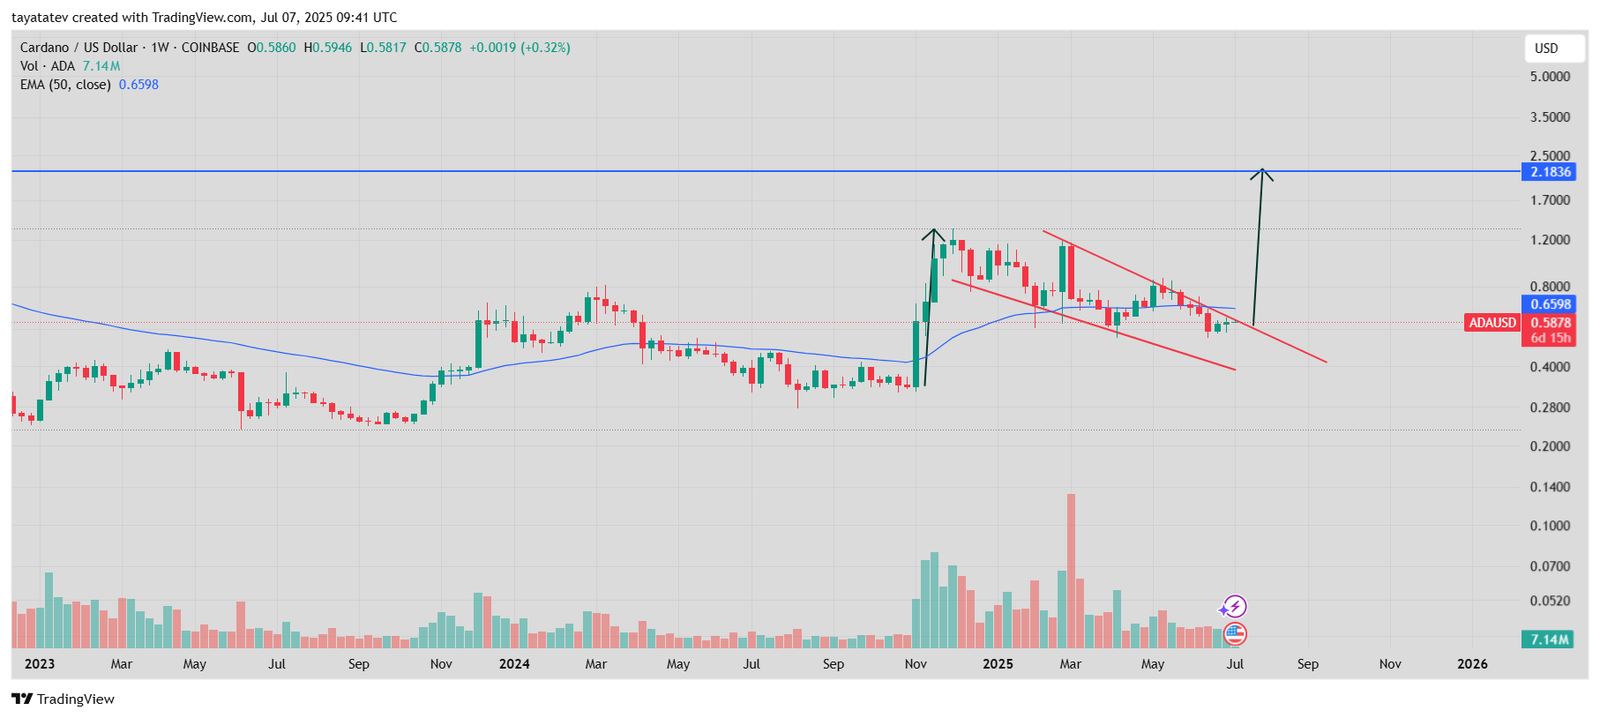
In this case, the pattern began forming in March 2025 after ADA peaked near $0.81. Since then, the price moved lower within the wedge boundaries, while the volume also declined—another classic characteristic of the pattern.
Currently, the price stands at $0.5878, just below the 50-week exponential moving average (EMA), which is at $0.6598. The chart shows that if ADA breaks out of the falling wedge, it could rally as high as $2.1836, which marks a 272% increase from the current level.
This target lines up with the projected height of the wedge added to the breakout point. Additionally, volume is beginning to show signs of recovery. If buyers continue to step in and push the price above the resistance line, ADA could confirm the breakout and start a bullish move.
Moreover, the weekly candle is approaching a decision point near the wedge’s upper trendline. A close above this line would likely validate the pattern. At that stage, the next resistance appears near $0.81, followed by the psychological level of $1.00.
Until then, ADA must hold above the local support of $0.54. If this level breaks down, the bullish setup could become invalid.
Cardano Weekly MACD Shows Bearish Momentum Weakening
The MACD indicator on Cardano’s weekly chart shows early signs of a potential shift in momentum. As of July 7, 2025, the MACD line stands at –0.0362 while the signal line is at –0.0170. The histogram, currently at –0.0193, remains in negative territory but has been steadily shrinking over the past few weeks.
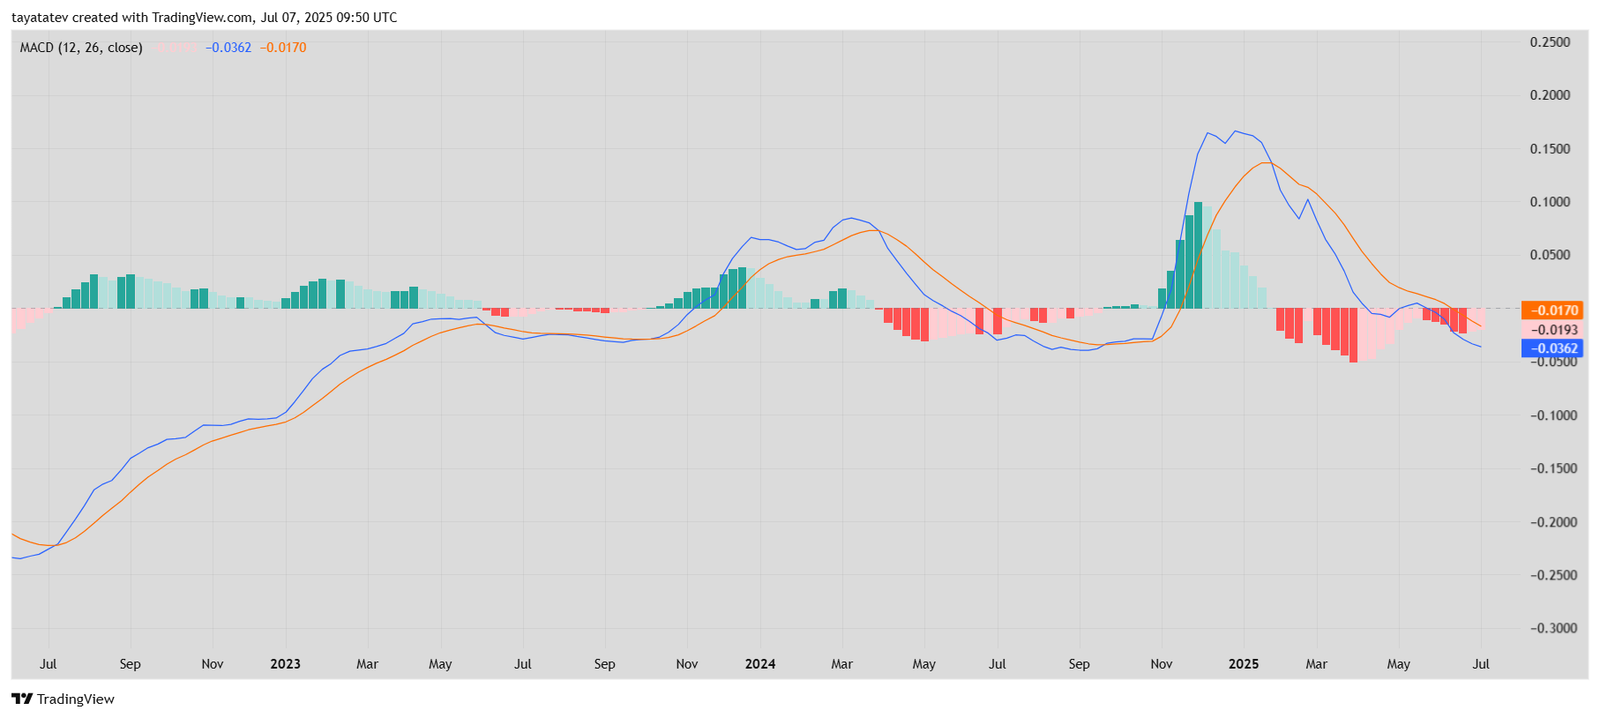
This trend indicates that although bearish pressure still dominates, sellers are gradually losing control. The shrinking red bars suggest that momentum is slowly reversing. If the MACD line crosses above the signal line, it will confirm a bullish crossover—an event that often precedes a price recovery in weekly timeframes.
Currently, the MACD and signal lines are moving closer together. This convergence increases the probability of a reversal, especially if supported by a breakout on the price chart. Until the crossover occurs, the signal remains neutral to bearish, but the chart structure suggests that a trend change could be approaching.
Cardano Weekly RSI Falls Below Neutral Zone
Cardano’s Relative Strength Index (RSI) on the weekly chart has slipped below the neutral 50 level, signaling weakening momentum. As of July 7, 2025, the RSI stands at 44.29, while its moving average is at 47.31.
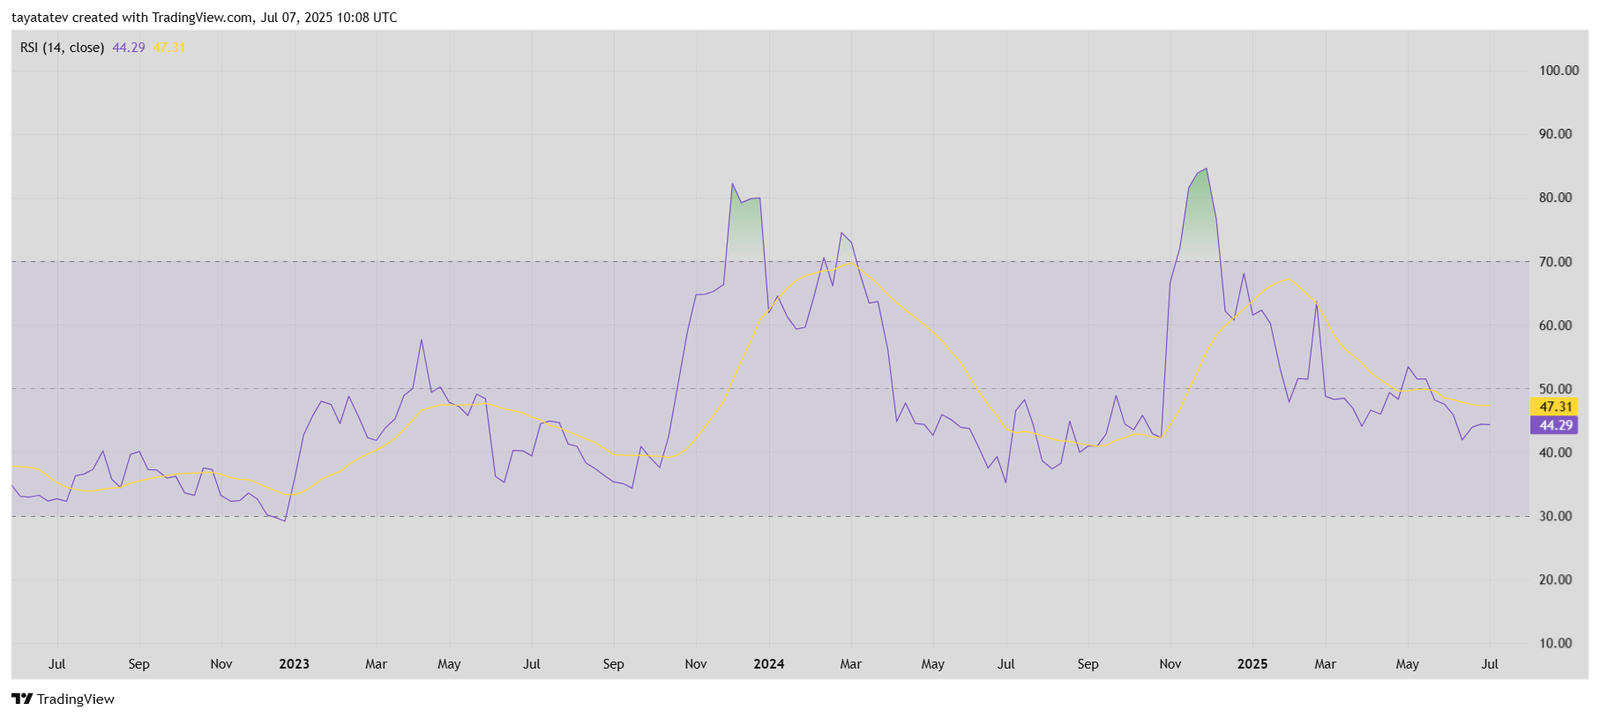
This drop below 50 suggests that ADA is in a bearish zone, though not yet in oversold territory. The RSI has been trending downward since March, following its failure to stay above the 60 mark earlier this year.
Unless the RSI reclaims a level above 50, ADA may continue to face pressure. However, it’s still far from the oversold threshold at 30, leaving room for either recovery or further decline depending on price action and volume in the coming weeks.
The current RSI level aligns with the consolidation phase visible on the price chart and supports the view that buyers are cautious, waiting for a breakout confirmation.
Cardano Price Compresses Inside Bollinger Bands
Cardano’s weekly chart shows the price tightening within the Bollinger Bands, suggesting a potential volatility expansion ahead. The current ADA candle is positioned near the lower half of the bands, trading at $0.5854, while the midline sits at approximately $0.6875.
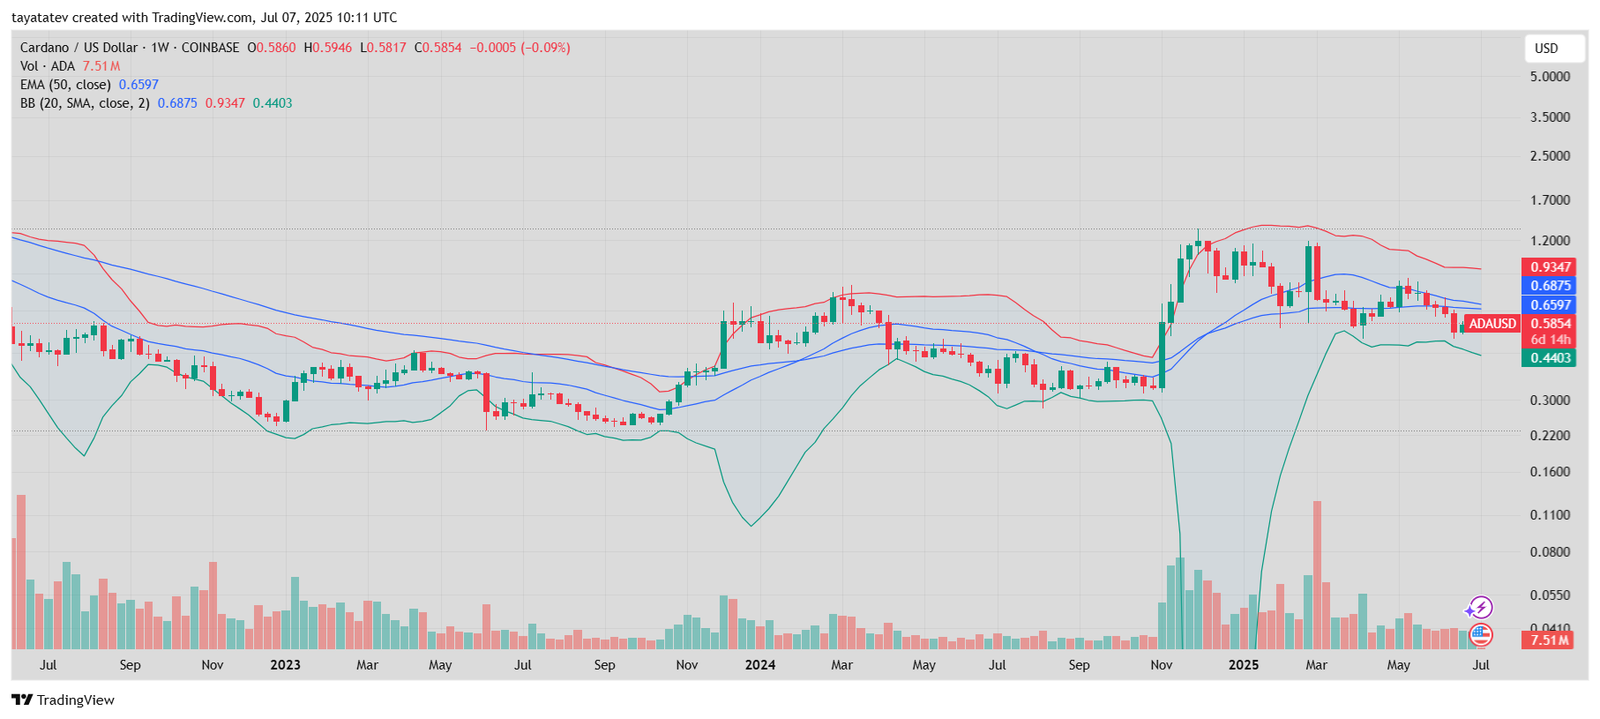
The upper band, located around $0.9347, and the lower band, near $0.4403, define the short-term volatility range. ADA has tested the midline several times in recent months but failed to close above it, indicating persistent bearish pressure.
The narrowing of the bands reflects decreasing volatility. Historically, such compression phases often precede a sharp directional move. If the price closes above the midline in the coming weeks, it could confirm a bullish reversal. On the other hand, rejection at this level may result in another leg down toward the lower band. For now, the Bollinger Bands suggest ADA is coiling for its next breakout.
