Cardano has introduced a new crypto card that allows users to spend crypto globally, stake ADA, and access ecosystem rewards. The card supports major cryptocurrencies, including Bitcoin (BTC), Solana (SOL), and Tether (USDT), enabling seamless payments worldwide.
Holders can also stake their ADA balance directly through the card. With each purchase, users earn rewards, combining daily spending with passive income. The card also allows users to borrow against ADA holdings without selling their assets.
Additionally, active cardholders receive early access to Cardano airdrops and invitations to new projects. The card offers full control over funds and integrates real-world asset tokenization for added utility.
Multi-Chain Rollout and Apple Pay Integration Coming in 2026
Cardano plans to release the crypto card in phases through 2026. Virtual and physical versions will be available first. Multi-chain support and compatibility with Apple Pay and Google Pay are expected between Q1 and Q2 of next year.
In the following quarter, Cardano will launch a Yield Card. This version will let users earn DeFi rewards while shopping, integrating tokenized assets and blockchain payments into one financial tool.
Alongside the crypto card, the Cardano Foundation has launched Reeve, a blockchain-based tool for enterprise financial reporting. Reeve integrates with existing ERP systems to provide tamper-proof, verifiable records.
It eliminates common issues like fraud, data silos, and manual errors by storing financial data directly on the Cardano blockchain. The tool modernizes enterprise finance workflows, linking traditional systems with decentralized infrastructure.
Cardano Breaks Out of Bullish Falling Wedge With 153% Upside Potential
The weekly chart shows Cardano ADA/USDT breaking out of a falling wedge pattern as of July 18, 2025. The pattern began forming after the rally in early 2025 and continued until mid-July. The price action stayed between two downward-sloping trendlines, creating a narrowing channel. This setup is known as a bullish falling wedge.
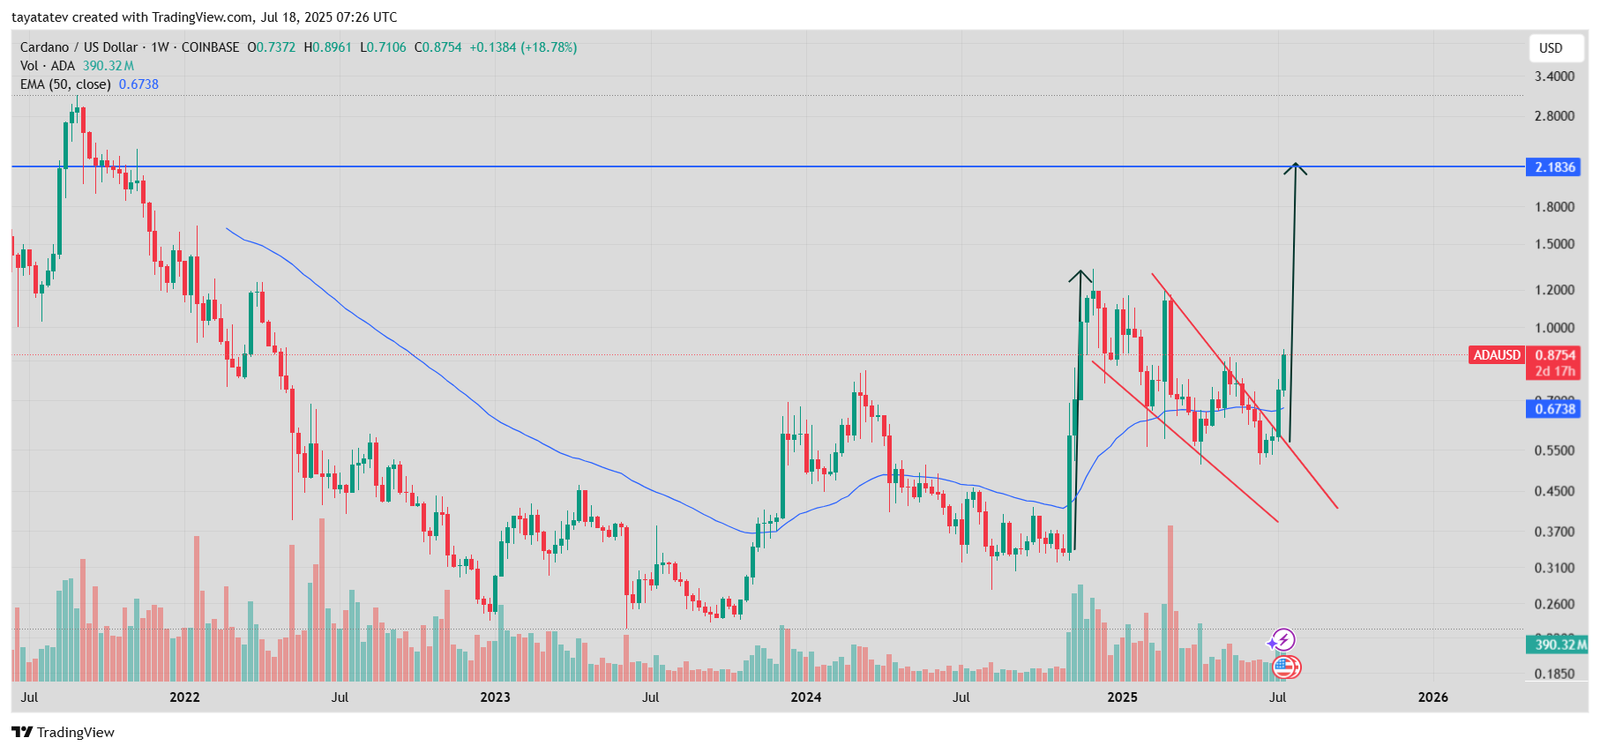
A falling wedge forms when the price moves lower but with a gradually decreasing slope. Both the highs and the lows get lower, yet the distance between them shrinks. Volume often declines during this pattern, and when the breakout comes, it usually signals a strong bullish reversal. The key confirmation occurs when the price breaks above the upper trendline of the wedge, which happened on the current chart.
At the time of the breakout, Cardano was trading at $0.8754. This represents a 59% gain from the wedge’s bottom. The chart marks the breakout with a long upward arrow, targeting the $2.1836 level. From the current price, this projected move represents an additional 153% increase.
The 50-week exponential moving average (EMA), now near $0.67, has flipped into support. The breakout aligns with increased volume, confirming the bullish momentum. If Cardano maintains this trajectory, the price may follow through toward the $2.18 target. The pattern and current price movement support the probability of continuation.
Cardano DMI Signals Strength Shift as Bulls Take the Lead
The Directional Movement Index (DMI) on Cardano’s weekly chart, updated July 18, 2025, shows a new bullish setup forming. The DMI indicator includes three lines: the blue line (+DI) represents bullish strength, the orange line (–DI) shows bearish strength, and the pink line (ADX) measures trend strength.
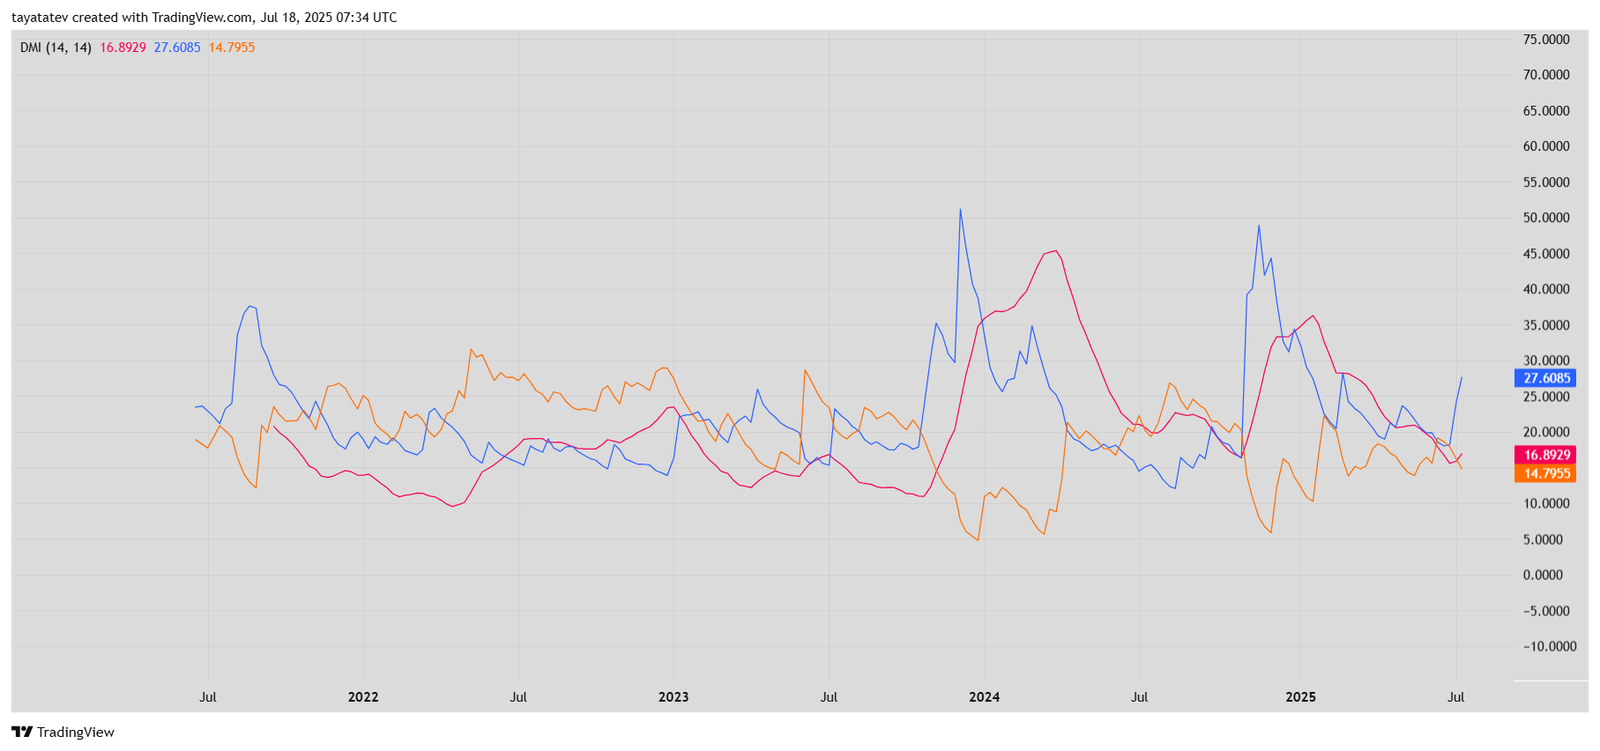
In the latest reading, the +DI sits at 27.60, rising sharply above both the –DI at 14.79 and the ADX at 16.89. This crossover signals a possible trend reversal in favor of buyers. When the +DI crosses above the –DI with a rising ADX, the market typically confirms a bullish trend. In this case, the +DI has broken above both key levels, pointing to growing bullish pressure.
The ADX line, although still below 20, has started to slope upward. This suggests the trend is gaining strength but has not yet reached full confirmation. If the ADX rises above 25 while the +DI remains on top, the breakout gains technical validation. Currently, the signal favors bulls, showing that buying momentum is increasing across weekly timeframes.
This shift in directional strength follows a recent breakout on ADA’s price chart, which supports the technical pattern of a falling wedge reversal. Together, these indicators highlight a potential continuation of Cardano’s upward movement.
Cardano Weekly RSI Confirms Bullish Momentum Shift
The Relative Strength Index (RSI) on Cardano’s weekly chart shows a clear uptick in momentum. As of July 18, 2025, the RSI value has climbed to 57.99, up from its recent low. This move above the neutral 50 mark signals growing buying pressure. When RSI rises above 50, it often indicates that bulls are gaining control, especially on higher timeframes like the weekly chart.
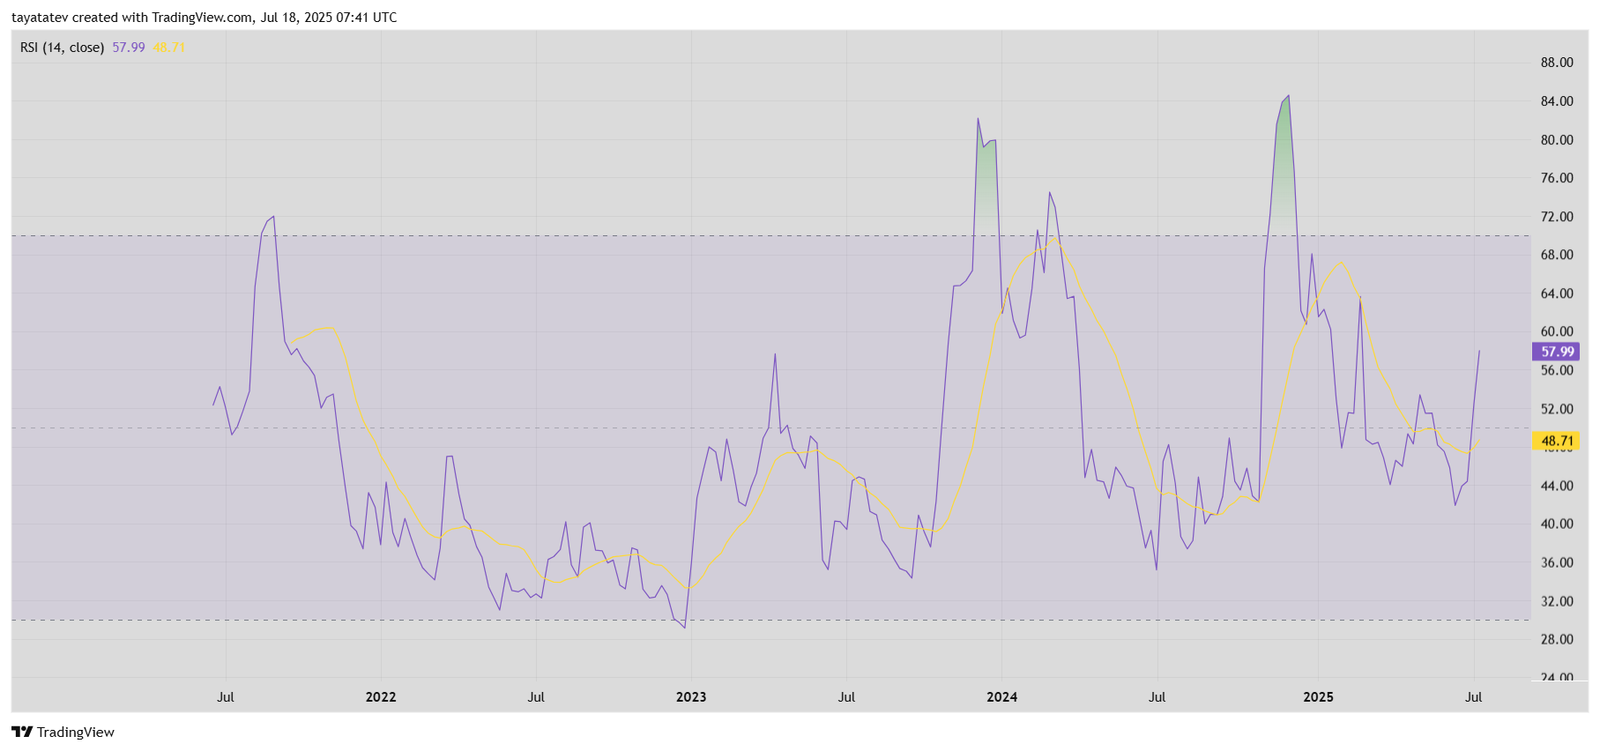
The yellow line on the chart represents the RSI’s moving average, currently positioned at 48.71. The RSI line has broken above it, confirming a momentum crossover. This kind of RSI and moving average divergence is often interpreted as a shift from neutral or bearish conditions to a more bullish trend setup.
The current level is still well below the overbought threshold of 70, suggesting more room for upside without immediate exhaustion. Past RSI peaks on this chart show that ADA has previously surged well into the 70s and 80s before topping out. The present move above the midline suggests the market may be entering a new bullish phase, with momentum accelerating as price action breaks out of long-term resistance.
Cardano MACD Lines Hint at Bullish Crossover on Weekly Chart
Cardano’s weekly MACD (Moving Average Convergence Divergence) chart shows early signs of a bullish shift as of July 18, 2025. The MACD line (blue) just crossed above the signal line (orange) at the 0.0068 level, while the signal line sits lower at –0.0129. This type of crossover is considered a bullish trigger, suggesting that momentum may soon favor the upside.
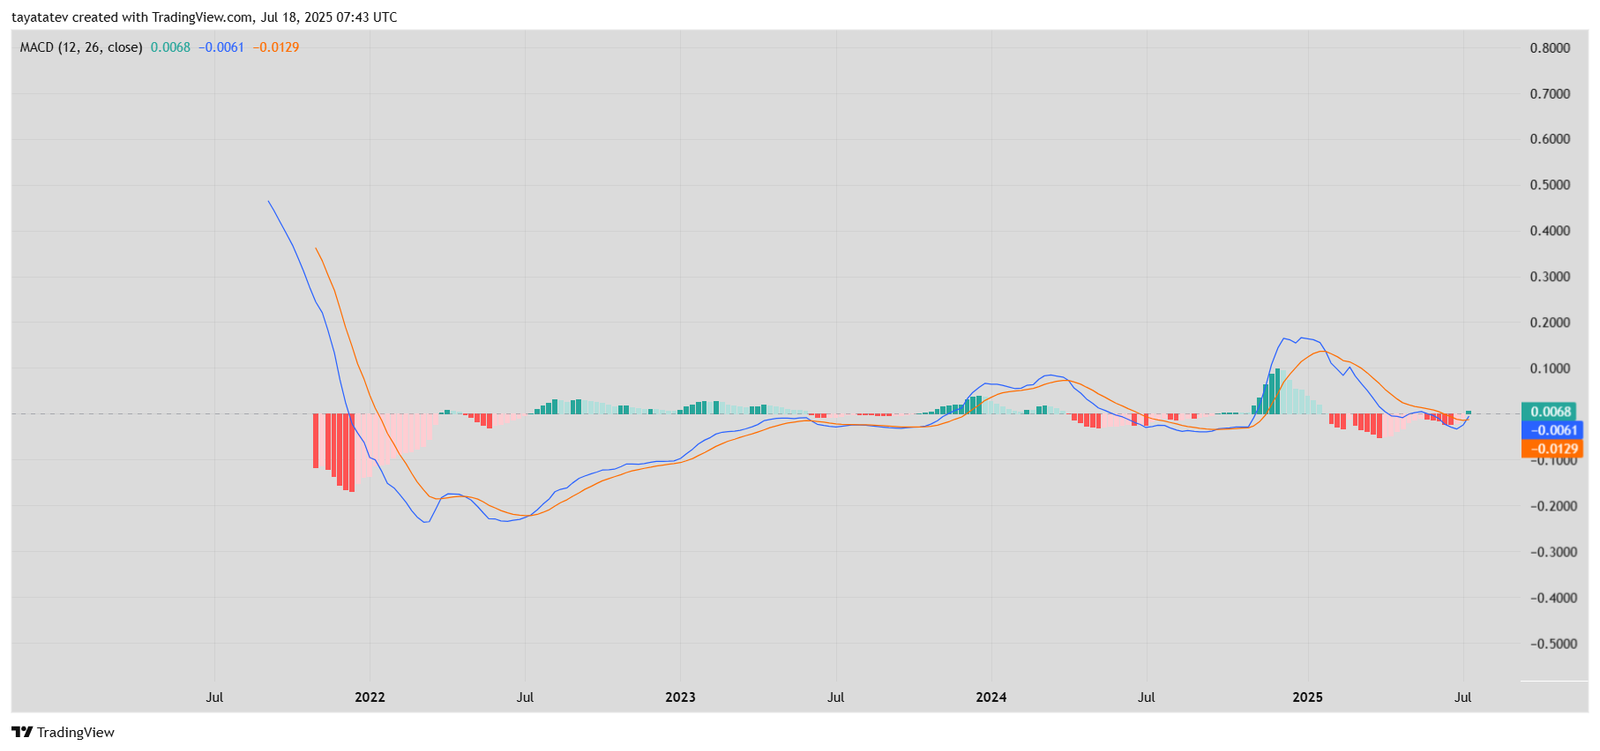
While both lines hover close to the zero level, the histogram bars have started turning green again. That shows the gap between the MACD and signal line is widening slightly in favor of bulls. The bars had been red throughout June and early July, indicating bearish pressure, but they now reflect a shift in market momentum.
A bullish MACD crossover like this often confirms a trend reversal when supported by other indicators. On the current chart, the crossover is shallow but still visible. If the MACD line continues rising and moves firmly into positive territory, it may confirm a full reversal. This MACD behavior follows Cardano’s breakout from a falling wedge and aligns with rising RSI and DMI indicators.
