
Analysts have issued bullish projections for Dogecoin (DOGE), with targets ranging from $0.25 to $4 in the coming months. The upper forecast implies a potential 1,900% gain from the current price of $0.1519. These predictions are primarily based on classical breakout patterns, including a cup-and-handle and a tight triangle formation. Both of these are typically interpreted as bullish continuation signals following prolonged consolidation phases.
Analysts Forecast Bullish Breakout for DOGE, But With Conditions
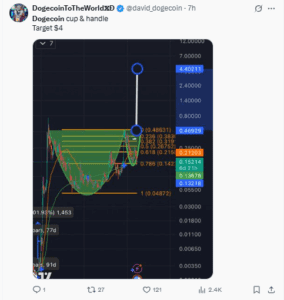
Analyst @david_dogecoin recently shared an analysis suggesting the formation of a cup-and-handle pattern on Dogecoin’s long-term chart. According to his projection, a breakout from this structure could push DOGE to $4, assuming the handle completes and breaks upward. This setup shows a period of accumulation followed by a short-term consolidation, with the implication of renewed upside momentum once resistance is cleared.
Another analyst, @CryptonautX, posted a chart showing a tight triangle pattern forming in Dogecoin’s recent price structure. He stated that the compression had reached a point where a breakout was “basically guaranteed.” His projection is more conservative, suggesting a move toward $0.25 if price breaks above the triangle’s resistance line.
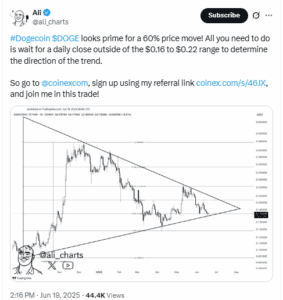
A third analyst, @ali_charts, provided a conditional forecast. He noted that Dogecoin looks set for a 60% move, but emphasized that confirmation depends on a daily close outside the $0.16 to $0.22 range. Until such a breakout or breakdown occurs, the direction remains uncertain, and both upward and downward outcomes are in play.
Dogecoin Technical Indicators Show Oversold Conditions, But No Reversal Yet
While these forecasts are optimistic, Dogecoin’s current technical condition does not yet validate such breakouts. As of June 23, DOGE is trading at $0.1519. This places it below all key exponential moving averages. The 20-day EMA sits at $0.1747, the 50-day at $0.1870, and the 200-day at $0.2091. All of these averages now act as resistance levels. This positioning confirms that DOGE remains in a downtrend, and any breakout will need to overcome multiple technical barriers.
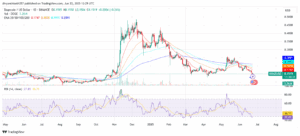
The Relative Strength Index (RSI) has dropped to 27.85. This places DOGE in oversold territory, a level that has historically coincided with short-term reversals. In August 2023 and January 2024, similar RSI lows preceded modest price rebounds. However, those reversals occurred during periods of stronger trading volume and rising on-chain activity. These are two factors that are currently absent. As a result, while the oversold condition suggests that a relief bounce is possible, the lack of confirmation from other indicators tempers the bullish case.
For the bullish chart patterns mentioned by analysts to materialize, Dogecoin must first reclaim key resistance zones. A daily close above $0.22 would mark the top of Ali’s defined breakout range, as well as bring DOGE above the 200-day EMA at $0.2091. This level is critical to reversing the medium-term trend.
Until that happens, the Dogecoin price remains in a descending structure with strong resistance from both horizontal levels and long-term moving averages. On the downside, failure to hold $0.15 could expose DOGE to a retest of its December 2024 low near $0.11, erasing more of the gains from the previous cycle.
Low Trading Volume Weakens Breakout Thesis
Current market participation levels raise further doubts about the validity of these bullish setups. Dogecoin’s daily trading volume stands at just 3.26 million DOGE. This figure is significantly lower than levels observed during previous breakouts. For example, in early 2021, Dogecoin’s volume during confirmed upward moves frequently exceeded 40 billion DOGE. It even surpassed 70 billion at its peak. Even the moderate rallies in 2022 and 2023 were supported by daily volumes between 8 and 15 billion DOGE.
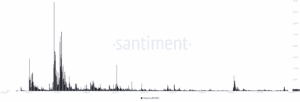
The current volume, by contrast, shows a lack of trader engagement and suggests that price movements—if they occur—may lack the momentum needed to be sustained. Without a notable rise in trading activity, any upward move from the triangle or cup pattern is likely to face resistance and fail to attract broader follow-through.
On-Chain Data Points to Weak Network Usage
Dogecoin’s blockchain metrics aligns with the cautious outlook. On June 23, the transaction count fell to just 31,900. This is a steep decline compared to the 2.1 million transactions seen during DOGE’s peak activity in late 2023. Similarly, the number of active addresses over a 24-hour period now stands at 59,800. This is far below the 1.6 million recorded in November 2024.
Development activity has also dropped sharply. As of June 19, only two active contributors were registered on Dogecoin’s GitHub repository.
This marks one of the lowest points in DOGE’s multi-year development history and it indicates that few updates or protocol improvements are underway. In previous growth cycles, rising developer activity played a key role in increasing network utility and investor confidence. The current stagnation reduces the likelihood of sustained user or market growth, regardless of price patterns.
