
Dogecoin (DOGE) fell 40% on October 10 after nearly $19 billion worth of crypto positions were liquidated across exchanges due to U.S.–China trade tensions and political uncertainty that that spooked traders. Since then, Dogecoin has steadied near $0.20, down about 72% from its all-time high of $0.7376.

Amid this pullback, an analyst known as Trader Tardigrade says Dogecoin’s current setup looks strikingly similar to the one that came before its 17,000% rally in 2021.
Analyst Says DOGE is Repeating Its Deep-Correction Pattern
Trader Tardigrade highlighted that Dogecoin tends to bottom out after heavy declines of roughly 70% to 80%. In 2020, the coin traded around $0.004 before rallying to $0.74 the following year — a gain of more than 17,000%. A comparable move occurred between 2015 and 2017, when a long slump gave way to a fresh uptrend.

He believes the market is showing the same setup again. With Dogecoin now down 72%, the current correction zone is almost identical to where previous long-term rallies began.
However, technical setup alone cannot determine this massive surge. In the futures market, open interest has risen to $2.09 billion, showing that more traders are opening positions again. Still, the funding rate of –0.0066% means short positions slightly outweigh longs, signaling cautious sentiment.

Daily trading volume has surged to $5.6 billion, around four times higher than early October, indicating stronger market activity since the sell-off.
Large holders continue to expand their Dogecoin positions, supporting the analyst’s view that long-term players are positioning for the next cycle. CleanCore Solutions has added more than 710 million DOGE, securing roughly $20 million in realized profits and targeting a 1-billion-token corporate treasury. In addition, the House of Doge partnered with Bitstamp by Robinhood to manage the Official Dogecoin Treasury, an initiative meant to promote transparency in major holdings.
Charts Show Price Holding Key Support
Dogecoin’s price continues to consolidate inside a wide upward channel that has held since April. Buyers have repeatedly defended the $0.18–$0.19 range, while sellers have limited upside moves near $0.28–$0.30.
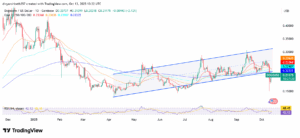
The 200-day moving average sits near $0.22, forming a short-term resistance zone. A close above that level could push DOGE price toward $0.28, while a sustained breakout above $0.30 would signal a shift toward a more extended recovery phase.
If the token slips below $0.18, it could revisit the $0.15 level, which acted as a base during August. The RSI sits close to 48. This shows that momentum is balanced — neither strong buying nor selling pressure are dominating right now.
If support holds, DOGE could gradually climb toward $0.22–$0.24 in the coming weeks, followed by a possible breakout attempt early next year — provided overall market sentiment improves.
