
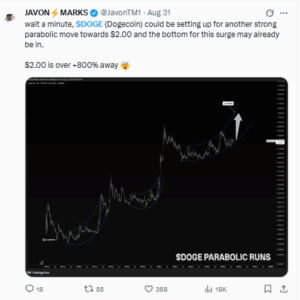
Crypto analyst Javon Marks said Dogecoin (DOGE) price could rally to $2, framing the move as a parabolic path once the token escapes its current compression. His chart shows a long-term breakout scenario that extends well beyond present ranges.
Analyst Ali highlighted $0.23 as the breakout trigger from a daily triangle. A triangle pattern forms when price prints lower highs and higher lows, creating a narrowing band. Ali noted that a daily close above $0.23 would confirm the breakout and start a new upward leg.
Coinglass Data Shows Balanced Leverage and Cooling Speculation
According to Coinglass, DOGE perpetual funding stood at 0.0106% on Aug. 31. Funding is the fee exchanged between long and short futures traders. A flat reading means neither side dominates, which often happens during consolidation.
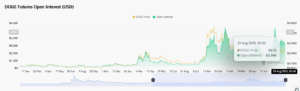
Coinglass also reported open interest at $3.36B on Aug. 29. Open interest measures the number of active futures contracts. The figure has eased from August highs, suggesting traders have reduced speculative exposure. Lower OI reduces the risk of forced liquidations, making a potential breakout less driven by leverage.
Coinglass snapshots placed daily spot volumes at $188.64M on Binance, $107.64M on OKX, and $66.96M on Upbit, with smaller figures on Bybit and Kraken. Strong activity on large venues signals liquidity if DOGE tests resistance.
Exchange flows, however, leaned toward supply. A seven-day Coinglass heatmap showed net inflows of $10.94M to Upbit, $8.23M to Binance, $2.84M to Kraken, and $2.49M to Coinbase. Inflows add tokens to exchanges, increasing the pool available for selling.
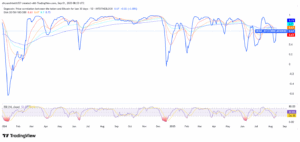
According to IntoTheBlock, Dogecoin’s 30-day correlation with Bitcoin stood at 0.67 on Sep. 1. Correlation measures how closely two assets move together. A reading near 1 means DOGE typically follows Bitcoin’s direction, which makes BTC’s trend an important factor for any breakout attempt.
DOGE Technical Chart Points to $0.25 on Break
On the TradingView daily chart, Dogecoin Price currently stands at $0.2186, just below the $0.23 trigger. The 20-day Exponential Moving Average (EMA) at $0.22102 capped intraday pushes, while the 50-day EMA at $0.21757 acted as nearby support. The 100-day and 200-day EMAs clustered near $0.211, forming a stronger base. EMAs smooth price movements and highlight trend direction; price above short-term EMAs often signals strength, while holds at longer EMAs reflect trend support.
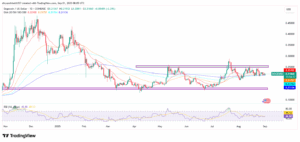
The Relative Strength Index (RSI) read 49, a neutral signal on its 0–100 scale. RSI gauges momentum, with values above 70 considered overbought and below 30 oversold.
Specifically, the visible triangle covers $0.21–$0.23, a band of about $0.02 or nearly 9% of the breakout line. A daily close above $0.23 would confirm Ali’s breakout trigger. Using the triangle’s height, the pattern projects an initial move toward $0.25. A retest and hold above $0.23 would reinforce the setup. Above all, failure to break leaves DOGE consolidating, while a drop below the EMA50 and the EMA100/200 cluster around $0.211 would delay the attempt.
