
Dogecoin holders are signaling renewed optimism as blockchain data shows a clear shift from selling to accumulation. According to Glassnode’s HODLer net position change metric, the red bars that usually highlight selling activity have nearly disappeared. This change reflects a reduction in liquidations by long-term holders (LTHs), creating conditions that favor stability rather than downward pressure.

The move from distribution to accumulation is important because long-term holders often act as the backbone of any cryptocurrency market. When these investors stop selling and begin holding or buying more, it reduces the immediate supply available on exchanges. That dynamic can help support price recovery and signal confidence in the asset’s long-term outlook. For Dogecoin, this adjustment in behavior may set the stage for a stronger recovery in the coming weeks.
Long-Term Holders Reduce Selling Pressure
Long-term holders historically influence Dogecoin’s market cycles because they control large amounts of supply. When they sell, the market faces additional pressure that often accelerates price declines. However, with fewer LTHs liquidating their holdings, the selling pressure has eased. The near disappearance of red bars in the HODLer net position chart shows that distribution has slowed significantly.

This type of activity is often interpreted as a bullish indicator. Instead of seeking short-term profit, long-term investors appear to be preparing for future growth by holding their positions. Such accumulation patterns usually accompany a shift in sentiment, where confidence in the asset’s potential outweighs the desire to exit the market during uncertain conditions.
Mid-Term Holders Add Billions in DOGE
Data also highlights an important trend among mid-term holders, who have been increasingly active in recent weeks. The supply of Dogecoin last active between three and six months has grown substantially, pointing to stronger confidence from this group of investors. In just two weeks, mid-term holders accumulated 4.9 billion DOGE, valued at more than $1.97 billion.
This rise in accumulation demonstrates that investors are positioning themselves for possible gains when market conditions improve. By increasing their holdings, mid-term participants are effectively betting on Dogecoin’s resilience and potential price appreciation. The scale of the accumulation suggests that these holders are not only confident but also willing to allocate significant capital to the asset despite recent volatility.
Confidence Builds Across Dogecoin Market
Together, the behavior of long-term and mid-term holders signals a broader trend of faith in Dogecoin’s outlook. Long-term holders are reducing selling pressure, while mid-term investors are actively buying more tokens. This combined activity reflects a constructive sentiment shift that contrasts with earlier periods of heavy selling.
If these trends continue, the Dogecoin market could experience stronger support levels and lower downside risk. While price action depends on multiple factors, including broader market conditions, the current on-chain data shows that investors who hold substantial amounts of DOGE are becoming more confident. Their actions may play a key role in shaping Dogecoin’s performance in the near term.
Dogecoin 4-hour Chart: Falling Wedge points to $0.296 if confirmed
On August 21, 2025 Dogecoin DOGE/USD traded near $0.2179 on the four hour chart from TradingView. Price action has carved a falling wedge, with lower highs and lower lows bounded by two downward sloping, converging trendlines. A falling wedge is a bullish reversal pattern in which momentum fades during the decline and a break above the upper boundary often signals a trend change.
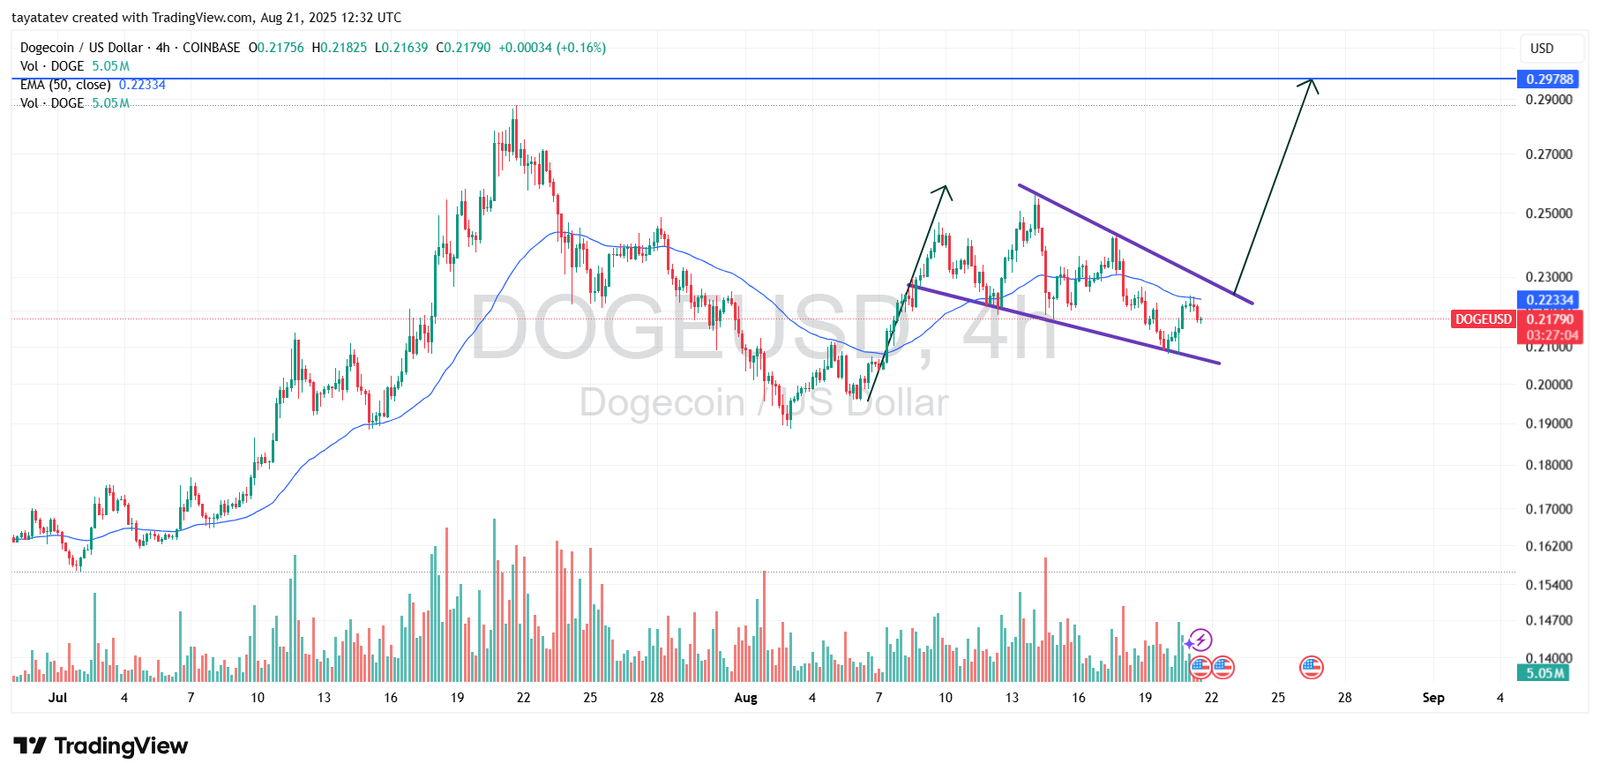
Price now sits just below the 50 period exponential moving average, or EMA, around $0.223. The upper wedge line crosses near $0.228 to $0.230, while the lower boundary tracks around $0.210. Volume has cooled through the contraction, which fits the typical setup before a breakout. Because the EMA is close to the upper trendline, reclaiming both in one move would strengthen the signal.
Confirmation requires a four hour close above the wedge’s top line, ideally holding above the EMA on a retest. If that occurs, the measured objective aligns with a thirty six percent advance from the current price, which projects to about $0.296. That target also matches the visible supply area highlighted near $0.298 on the chart, creating a confluence zone for potential resistance.
Until price breaks out, the setup remains unconfirmed. Failure to clear and hold above $0.230 would keep Dogecoin inside the pattern and leave risk toward the lower boundary near $0.210. A decisive close below that support would invalidate the wedge and argue for further consolidation. For now, on chain accumulation tailwinds and the contracting structure favor patience while the chart waits for a clear break and close.
Dogecoin 4-hour RSI signals neutral momentum
On August 21, 2025 at 12:39 Coordinated Universal Time, the Relative Strength Index (RSI) for Dogecoin on the four hour timeframe showed a reading near 45. The RSI is a momentum oscillator that measures the speed and magnitude of price movements on a scale from zero to one hundred. A value of seventy or higher typically signals overbought conditions, while a value of thirty or lower suggests oversold conditions.
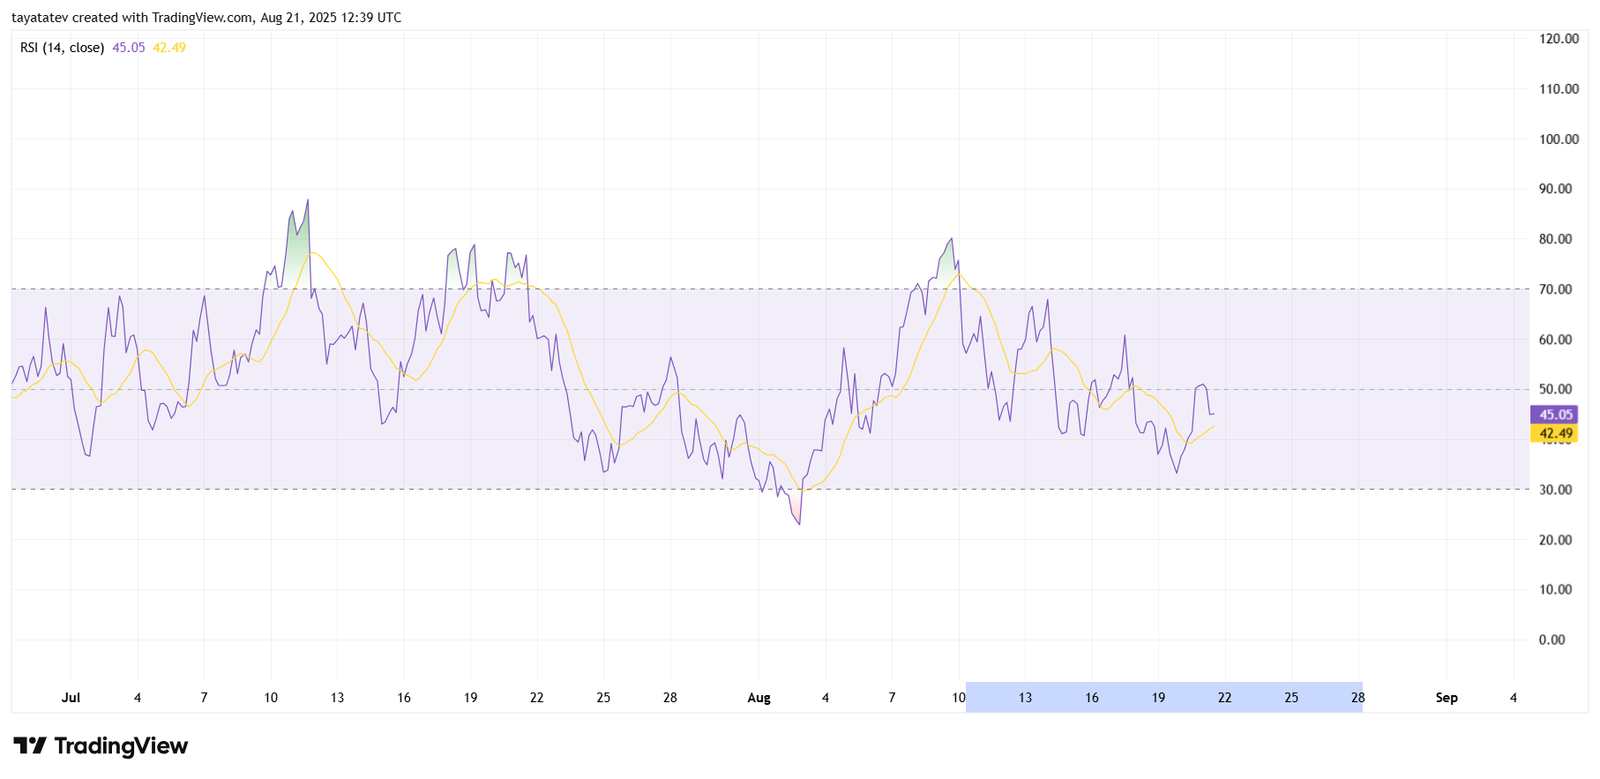
The current RSI reading places Dogecoin in a neutral zone, neither overbought nor oversold. This level shows that momentum has cooled after recent declines but has not yet shifted into extreme weakness. The yellow moving average line, plotted alongside the RSI, also trends close to the current RSI level at 42. This alignment indicates that short term momentum remains balanced and lacks a decisive direction.
Recent RSI swings between thirty five and sixty highlight that Dogecoin has struggled to generate sustained strength. The chart shows repeated attempts to move above the midpoint of fifty, but each advance has faced resistance. This repeated rejection reflects lingering caution among traders and suggests that momentum is not yet strong enough to confirm a clear bullish trend.
If the RSI rises and holds above fifty, it would indicate strengthening momentum that could align with a breakout from Dogecoin’s falling wedge pattern on the price chart. Conversely, if the RSI slips closer to thirty, it would highlight mounting bearish pressure and increase the risk of further declines. For now, the RSI shows a market in balance, waiting for stronger directional signals from price action.
