Dogecoin gained over 5% in the last 24 hours, rising from $0.200 to $0.210 during a sharp late-session rally. The price broke above the key resistance zone following a wave of large transactions and institutional volume.
Data from Coinalyze showed two major spikes in trading volume—615 million and 582 million DOGE—during the 03:00–04:00 UTC window. These came with significant futures activity, including multiple trades exceeding $1 million. Overall, the derivatives market recorded nearly $1.5 billion in 24-hour DOGE futures volume, marking a notable shift from recent retail-driven trends.
Analysts noted that Dogecoin maintained higher lows throughout the session, reinforcing short-term bullish momentum. The surge aligned with broader crypto market gains, as Bitcoin reached a new high of $122,565 and Ethereum rose past $3,000.
DOGE held firmly above the $0.200 level, which now acts as immediate support. Resistance lies between $0.213 and $0.220. If momentum continues and the price holds above $0.208, traders may target the next leg toward $0.215 and beyond.
The recent movement comes amid favorable macro conditions. Falling U.S. inflation, anticipated rate cuts, and positive sentiment around crypto legislation have lifted overall market demand. These factors, combined with increased whale activity, supported Dogecoin’s rally.
At press time, Dogecoin trades at $0.209, up 5.05% on the day, with daily trading volumes exceeding $2.5 billion.
Dogecoin Breaks Bullish Flag, Signals 34% Price Target
On July 14, 2025, Dogecoin DOGE/ USDT confirmed a breakout from a bullish flag pattern on the daily chart, as seen on TradingView. A bullish flag pattern forms when a strong upward price movement, known as the flagpole, is followed by a downward-sloping consolidation range, or flag. When the price breaks above the flag resistance, it often signals a continuation of the previous uptrend.
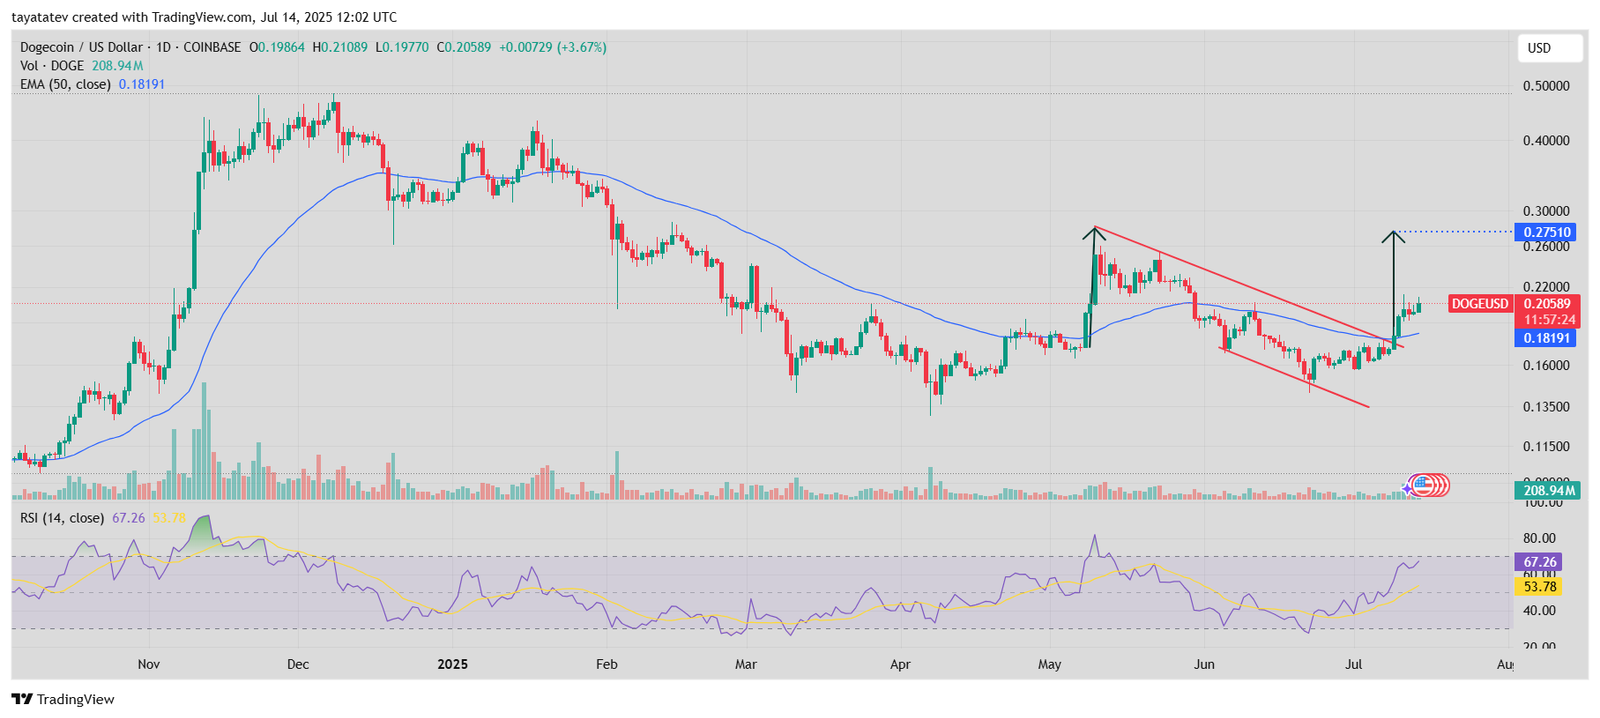
The breakout occurred above the flag’s upper boundary near $0.188. From that level, DOGE has already surged around 18%, reaching $0.20589 at the time of analysis. The projected move, based on the height of the flagpole, suggests another 34% increase from the current price. If this breakout fully plays out, the DOGE price could climb to approximately $0.275.
The 50-day Exponential Moving Average (EMA) currently sits at $0.18191 and is trending upward, showing growing bullish momentum. Volume also rose alongside the breakout, confirming strong buying interest. The Relative Strength Index (RSI) reads 67.26, approaching overbought territory but not yet signaling exhaustion.
In summary, Dogecoin broke out of a textbook bullish flag, already gained 18%, and remains on track for a possible 34% rally to the $0.275 zone, barring a reversal or rejection near short-term resistance.
Dogecoin Breaks Ichimoku Cloud With Weak Bullish Signal
On July 14, 2025, Dogecoin (DOGE) closed at $0.20554 after testing resistance near $0.210. The price moved above both the 50-day Exponential Moving Average (EMA) and the Ichimoku Cloud, confirming a weak bullish signal on the daily chart. This breakout aligns with improving market sentiment and growing buyer strength.
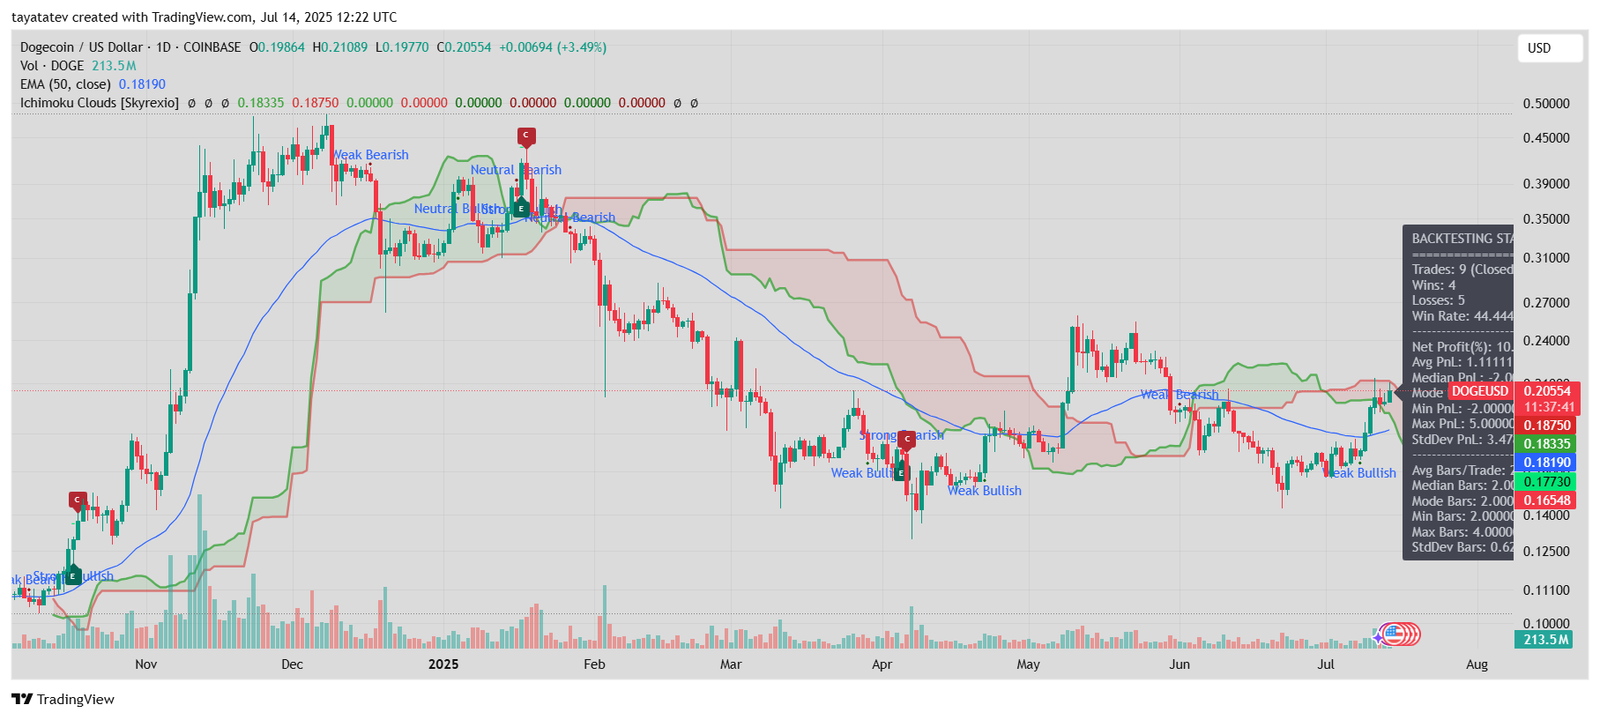
The Ichimoku Cloud, also known as Kumo, helps identify support, resistance, and trend direction. When the price breaks above the cloud and both the conversion line (Tenkan-sen) and baseline (Kijun-sen) align positively, it signals a possible bullish trend continuation. In this case, although the cloud thickness indicates prior consolidation, the price now trades cleanly above it.
Volume reached 213.5 million DOGE, showing increased market participation. The EMA at $0.18190 now acts as dynamic support. Meanwhile, the current price also stands above the upper boundary of the Ichimoku Cloud, suggesting a gradual shift toward bullish dominance.
Backtesting statistics on the chart show a 44.4% win rate from recent trade signals, with net profit of 10.0% and a median gain per trade of 2.0%. These figures reflect modest but consistent performance during periods of similar setups.
If DOGE sustains levels above the cloud and $0.18750 resistance, momentum may continue toward the $0.220–$0.230 range. However, a drop back below the cloud could indicate trend weakness.
Dogecoin Momentum Turns Positive as SMI Crosses 50
On July 14, 2025, the Stochastic Momentum Index (SMI) for Dogecoin moved above the +50 threshold, with the SMI line at 52.87 and the signal line at 52.54. This crossover confirms a bullish momentum shift on the daily chart.
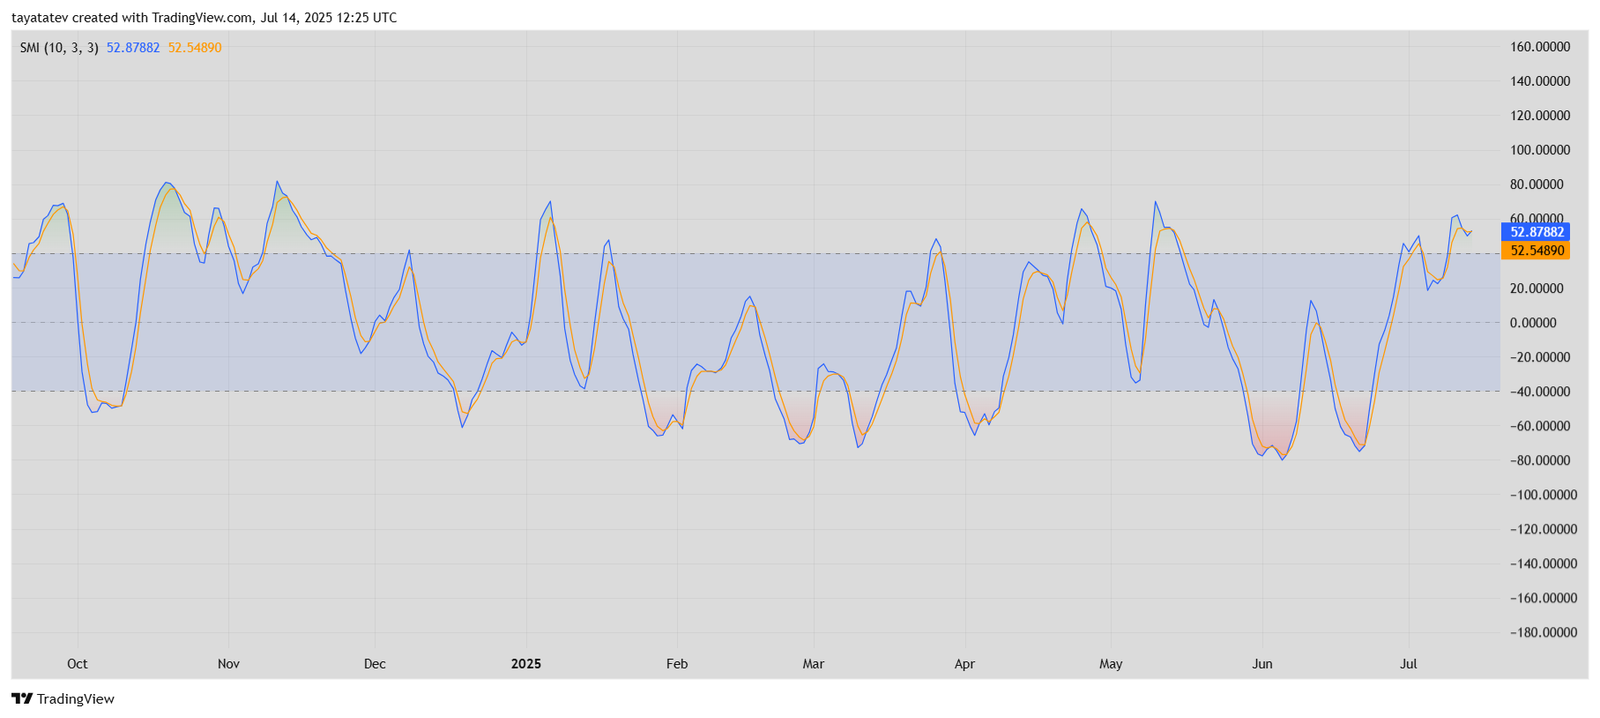
The SMI is an improved version of the traditional stochastic oscillator. It measures the distance of the current closing price relative to the midpoint of the high-low range. When the SMI rises above +40 or +50, it indicates strong bullish pressure. In this case, both the main line and signal line are rising in parallel, showing trend continuation rather than a short-term spike.
Previously, similar SMI crossovers above 50 coincided with short-term price rallies. Current readings show steady upward slope with no signs of divergence, reinforcing ongoing strength in the DOGE market.
If the SMI continues rising above 60, momentum could carry the price toward the projected resistance range near $0.275, as indicated in earlier chart analysis.