
NAIROBI (Coichapter.com)— Dogecoin price is showing signs of a potential breakout after weeks of consolidation. Traders are closely watching a descending triangle pattern that suggests a volatile move could be ahead. Analysts see $0.22 as a strong support, with some predicting a 55% surge if DOGE can break key resistance levels.
Dogecoin’s “Boring Phase” Might End Soon
Dogecoin price is stuck in what analysts call the “boring phase,” but that might not last much longer. The meme coin has been moving sideways for weeks, and traders are getting impatient. However, several analysts believe a breakout is brewing, and if it happens, DOGE could see a major price surge.

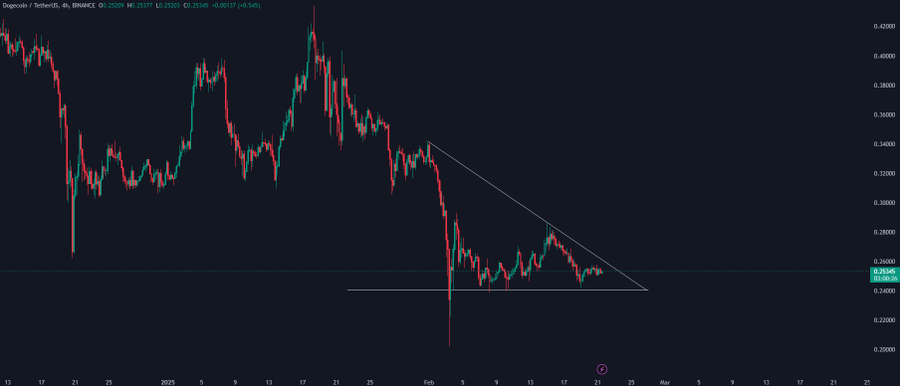
Trader Tardigrade noted that Dogecoin is consolidating tightly, which often happens before big moves. According to him, a breakout could be on the horizon, and when it comes, it could be explosive.
Source: X
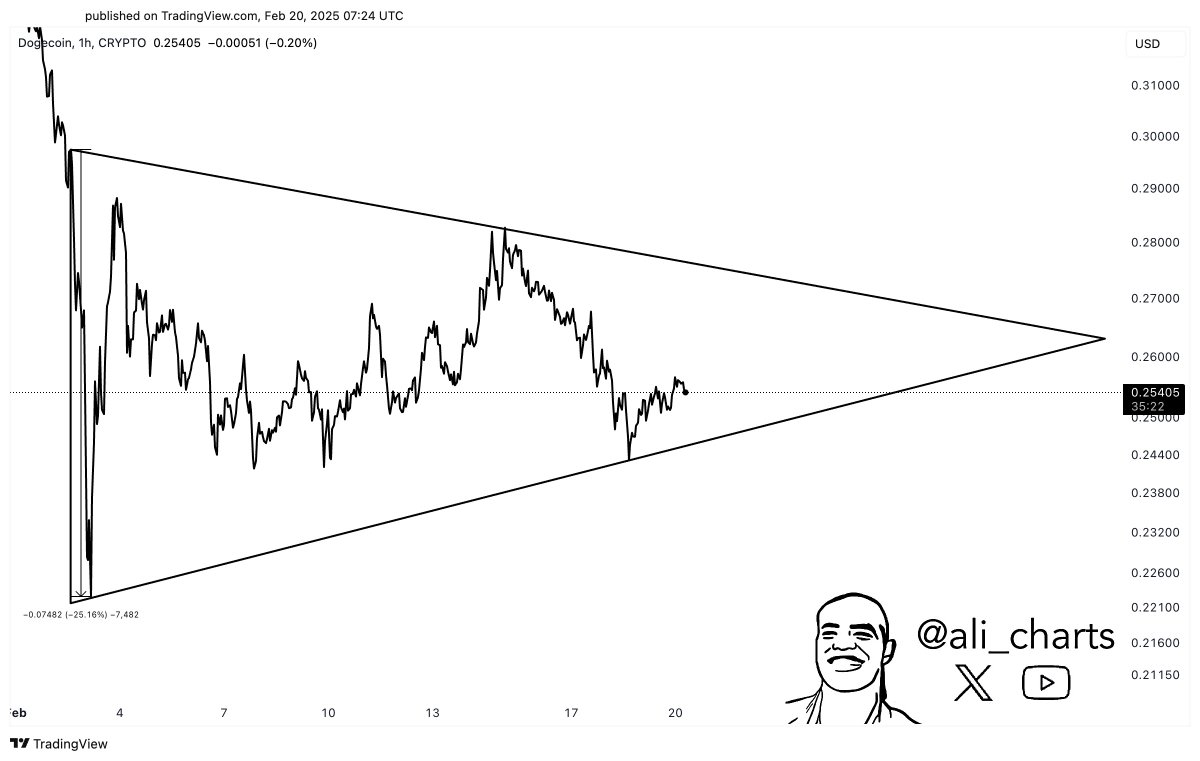
Another analyst, Ali Martinez, pointed out that DOGE is forming a symmetrical triangle pattern—a technical setup that often leads to major price swings. He predicts a 25% move in either direction, depending on which way the price breaks.
$0.22 Support Holds—Is This the Ultimate Buy Zone?
Altcoin Scholar noted that $0.22 has acted as a strong foundation for Dogecoin price, preventing further declines. This level aligns with a past accumulation zone where buyers aggressively stepped in. If DOGE maintains this support, traders might view it as an ideal entry point for long positions.
Source: X
Dogecoin’s daily chart reveals a descending triangle, a pattern that often leads to strong breakouts. If DOGE breaks above the descending trendline, it could confirm a bullish continuation. The Fibonacci retracement levels indicate key resistance at $0.37 and $0.48, aligning with past price rejections.
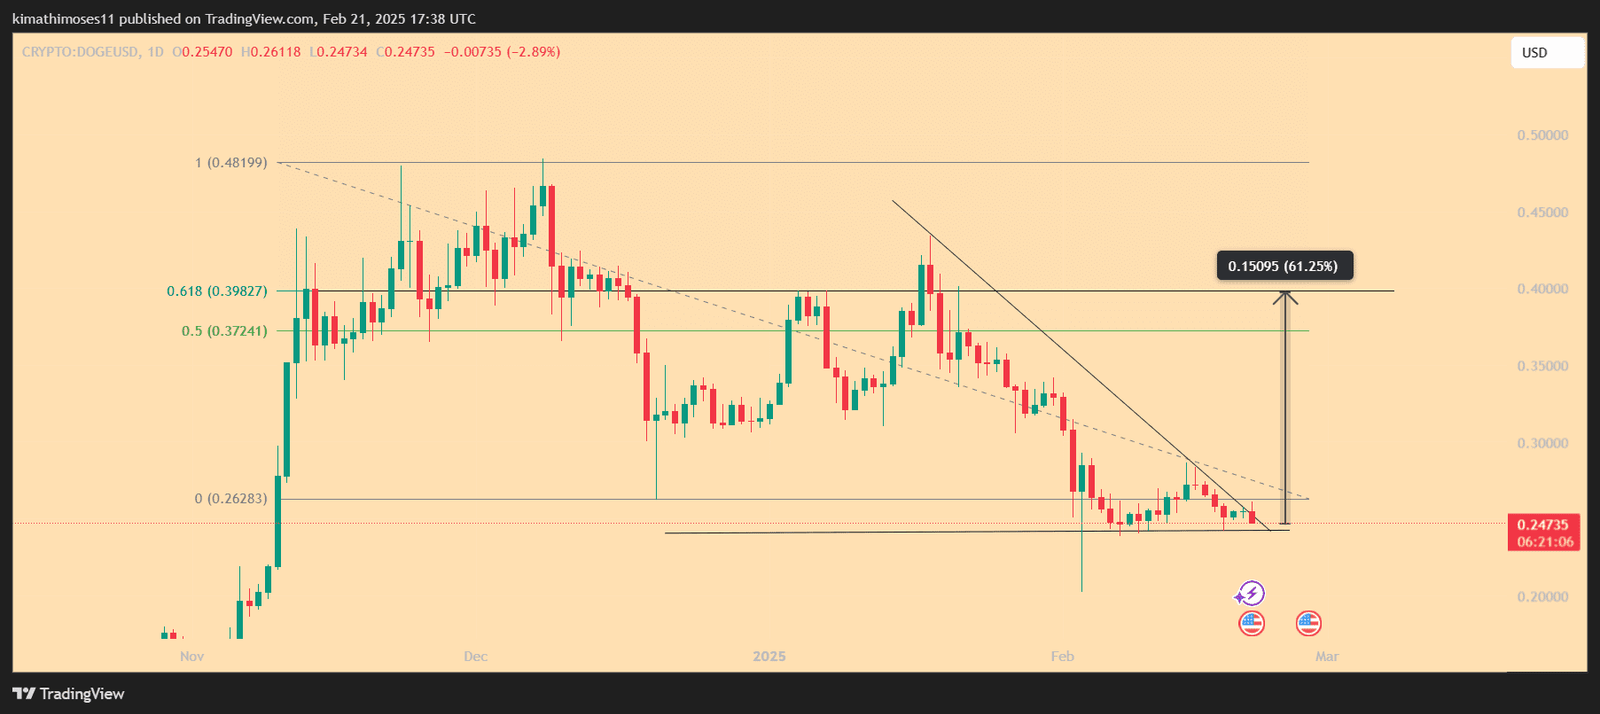
The Relative Strength Index (RSI) sits at 38, suggesting DOGE is nearing oversold conditions, which could trigger buying pressure. Additionally, the 55% breakout projection stems from measuring the triangle’s height and extrapolating a move above resistance.
Meanwhile, analyst Mayne pointed out that Dogecoin’s high-timeframe structure is shaping up for a bullish breakout. He emphasized that a monthly close above resistance would be a strong confirmation of an uptrend.
