
On June 3, 2025, the 1-hour chart for Dogecoin (DOGE/USD) formed an ascending channel pattern. This pattern appears when price action moves between two parallel upward-sloping trendlines. It often signals a temporary recovery in a broader downtrend and usually resolves with a breakdown.
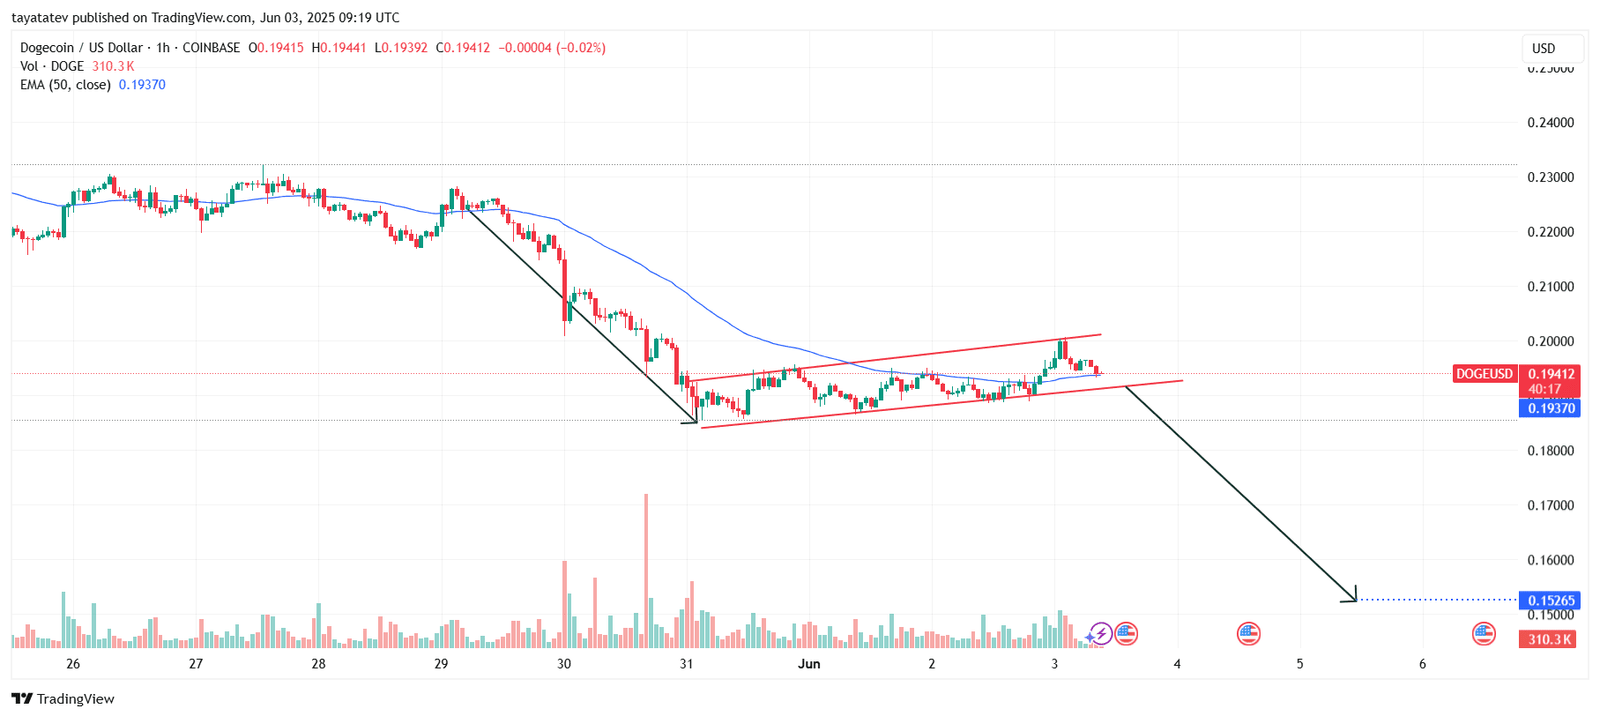
In this case, Dogecoin trades at $0.19412 and moves near the lower boundary of the ascending channel. If the price breaks below this support, it would confirm the pattern and suggest a further drop.
The projected target sits at $0.15265, marking a 21% decline from the current price. The target comes from measuring the height of the channel and extending it down from the breakdown point.
The 50-period Exponential Moving Average (EMA), now at $0.19370, acts as dynamic resistance. Price is currently struggling to stay above this level, adding pressure from above.
Volume shows no strong signs of accumulation. The recent lower highs also support weakening momentum inside the channel.
If sellers push the price below the channel, confirmation of the pattern would likely trigger a fast move toward the $0.15265 level.
Dogecoin RSI Signals Neutral Momentum Amid Pattern Breakdown Risk
On June 3, 2025, the Relative Strength Index (RSI) for Dogecoin (DOGE/USD) on the 1-hour chart stood at 50.05, with the RSI-based moving average at 58.70. The RSI (Relative Strength Index) measures the strength and speed of recent price movements. Readings above 70 indicate overbought conditions, while those below 30 signal oversold pressure.
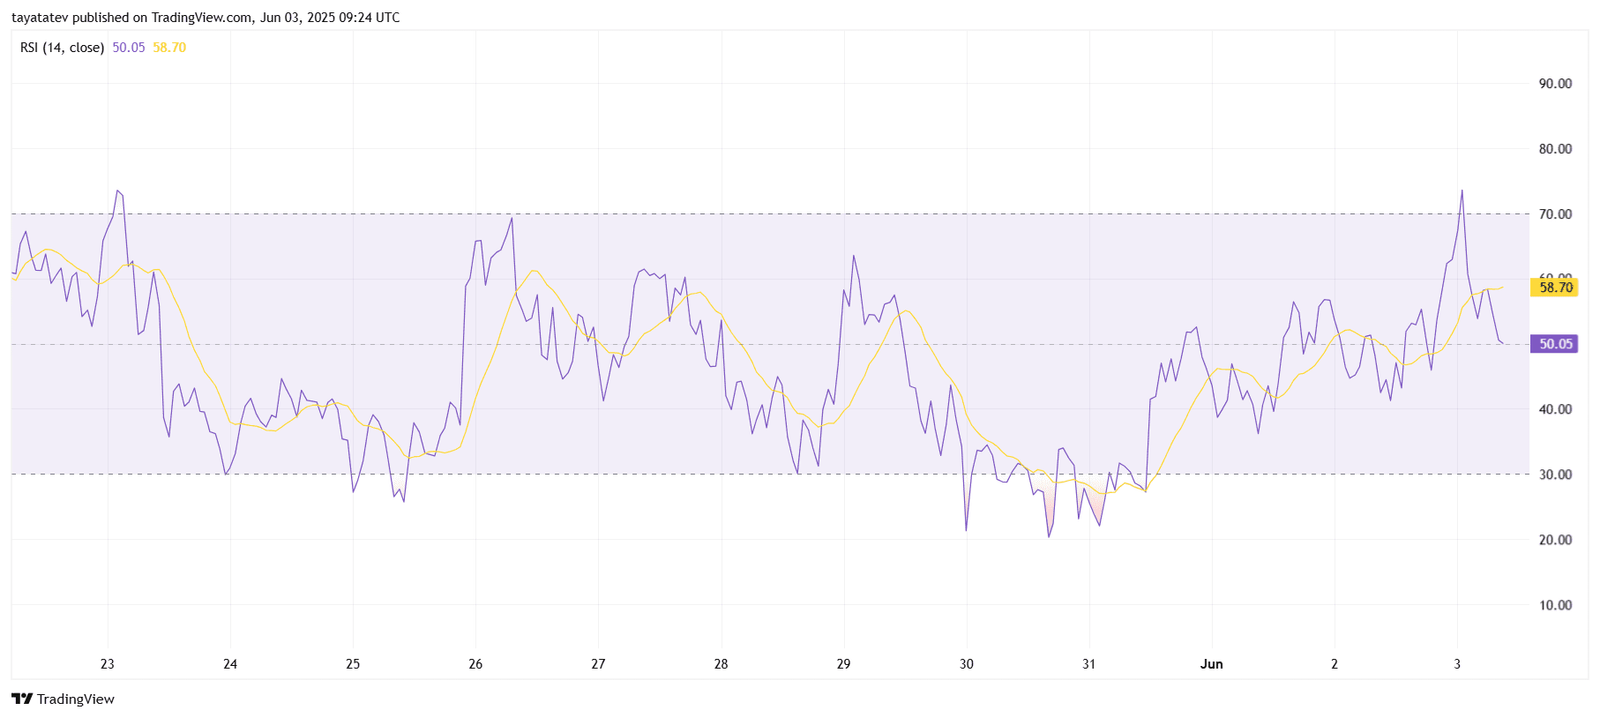
Currently, the RSI hovers near the midpoint of 50, showing neutral momentum. The price lost strength after touching near 70 on June 2, suggesting a pullback from short-term bullish momentum.
While DOGE stays inside a weakening ascending channel, the RSI now drops below its signal line. This crossover hints that sellers are gaining traction. If this trend continues, it would support the technical breakdown scenario shown in the price chart.
So far, no strong reversal signals have appeared on the RSI. Instead, the indicator points to fading bullish strength with a possible slide into bearish territory. If RSI breaks below 45 with volume confirmation, it may add weight to the 21% downside projection toward $0.15265.
Dogecoin BBTrend Peaks, Signals Potential Exhaustion of Uptrend
The BBTrend (Bollinger Band Trend) indicator for Dogecoin (DOGE/USDT) showed a strong positive value of 18.56. This value follows a sharp rise that peaked above 30 earlier in June, marking the strongest bullish momentum in over four months.
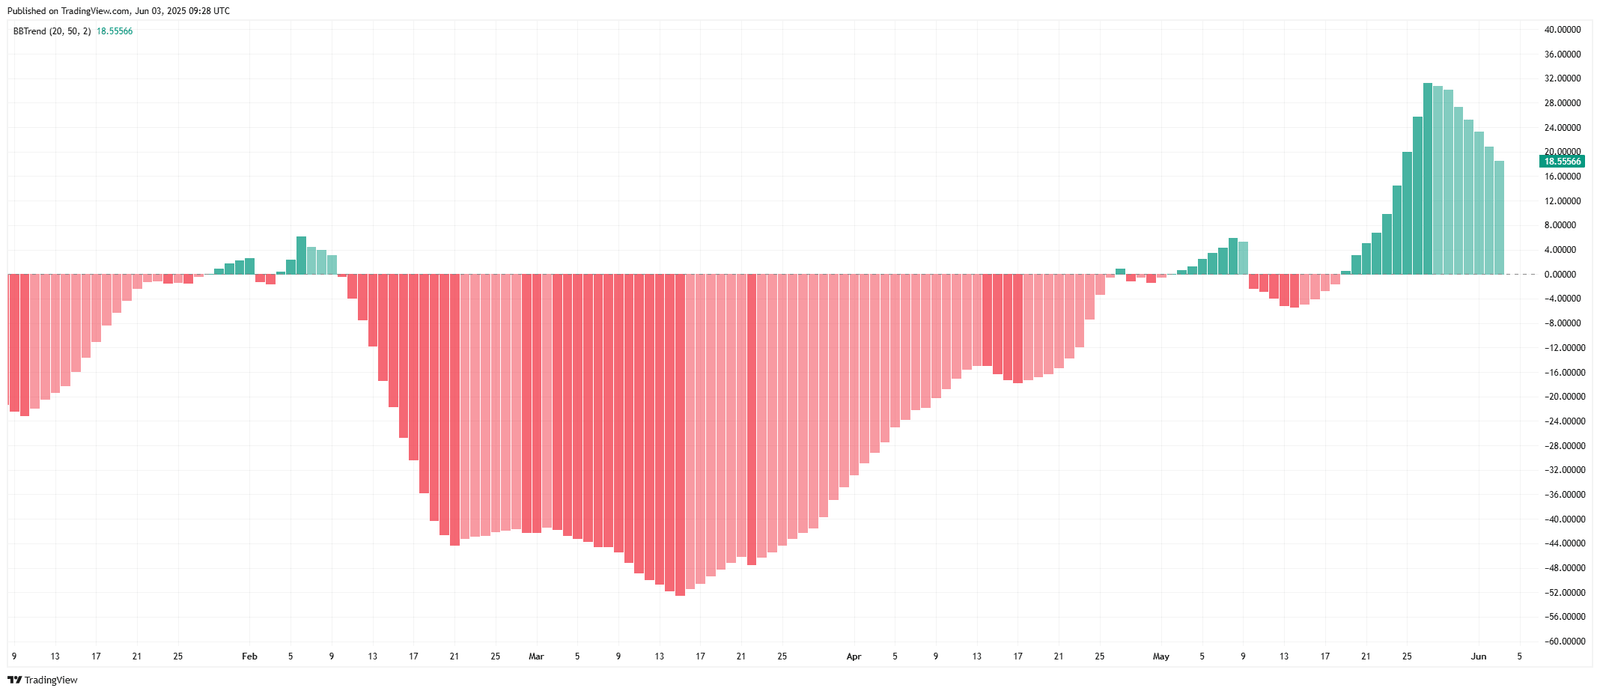
The BBTrend measures price deviation from the mean using the Bollinger Bands and moving averages. Values above zero signal an uptrend, while values below zero indicate a downtrend. The higher the positive value, the stronger the trend.
Recently, the indicator flipped from deep negative territory in April to strong positive in late May. This shift confirmed the bullish reversal. However, the current decrease in green bar height signals a slowdown. If this pattern continues, it may suggest the bullish move is losing strength.
Although the BBTrend remains positive, its declining slope can act as an early warning of a momentum fade. If the bars continue shrinking or shift back to red, that would align with the bearish breakdown risk seen in Dogecoin’s ascending channel pattern.
Dogecoin DMI Shows Weakening Trend Strength as Indicators Converge
On June 3, 2025, the Directional Movement Index (DMI) for Dogecoin (DOGE/USDT) displayed a weakening trend. The indicator consists of three lines:
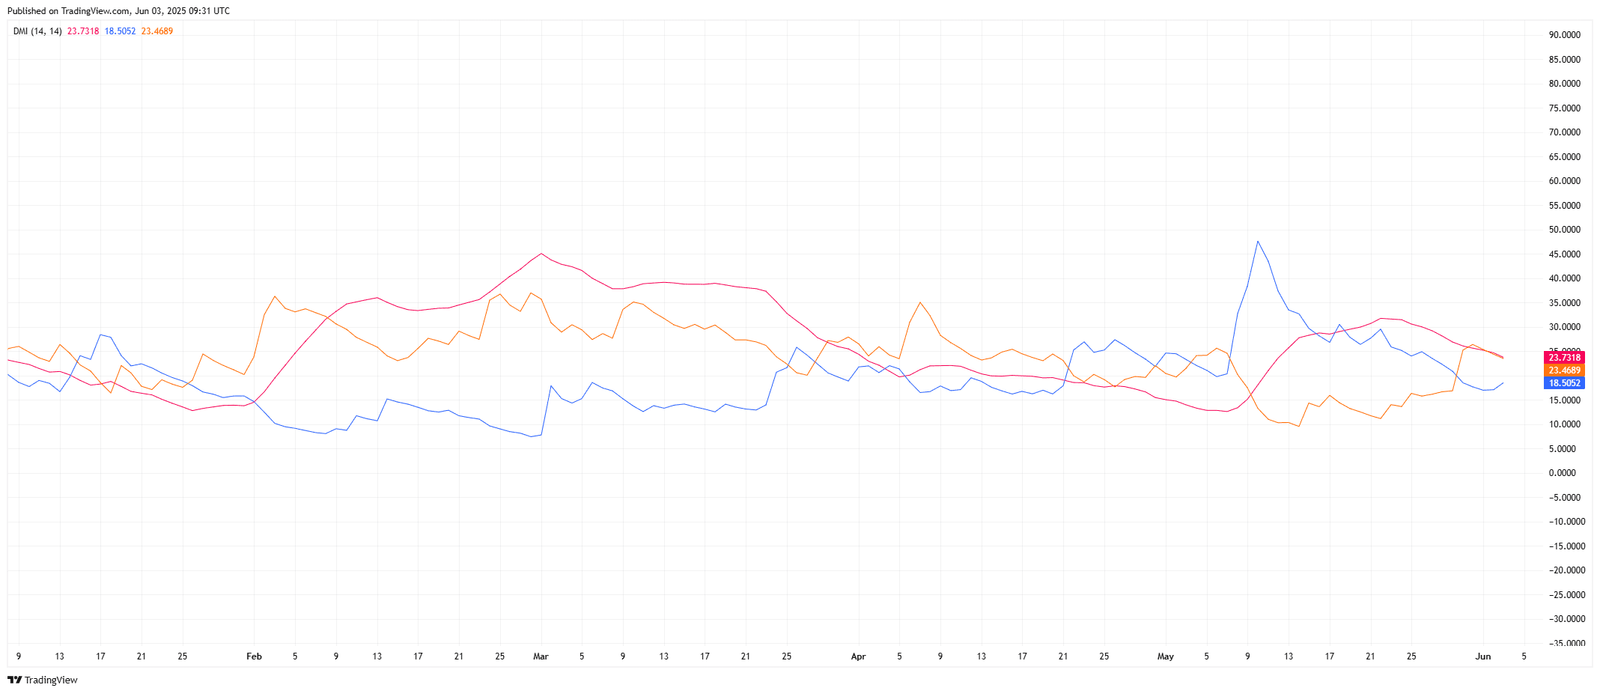
+DI (Positive Directional Index) – orange line: 23.4689
–DI (Negative Directional Index) – blue line: 18.5052
ADX (Average Directional Index) – red line: 23.7318
The DMI measures trend direction and strength. A strong trend is present when the Average Directional Index (ADX) is above 25 and rising, with wide divergence between the +DI and –DI lines.
In this case, the ADX is below the 25 threshold and slightly declining, indicating weak trend strength. Although +DI remains above –DI, the gap is narrowing. This suggests that bullish momentum is fading and the market may shift to range-bound or sideways behavior.
If –DI crosses back above +DI and the ADX begins to rise again, it would confirm renewed bearish pressure. For now, the data reflects uncertainty, aligning with the risk of breakdown seen in Dogecoin’s ascending channel structure.
Dogecoin MACD Flips Bearish as Momentum Weakens Further
Meanwhile, the Moving Average Convergence Divergence (MACD) indicator for Dogecoin (DOGE/USDT) confirmed a bearish crossover. The MACD line (blue) dropped to –0.00216, moving below the signal line (orange), which stands at 0.00353. The MACD histogram also prints red bars, with the latest value at –0.00569.
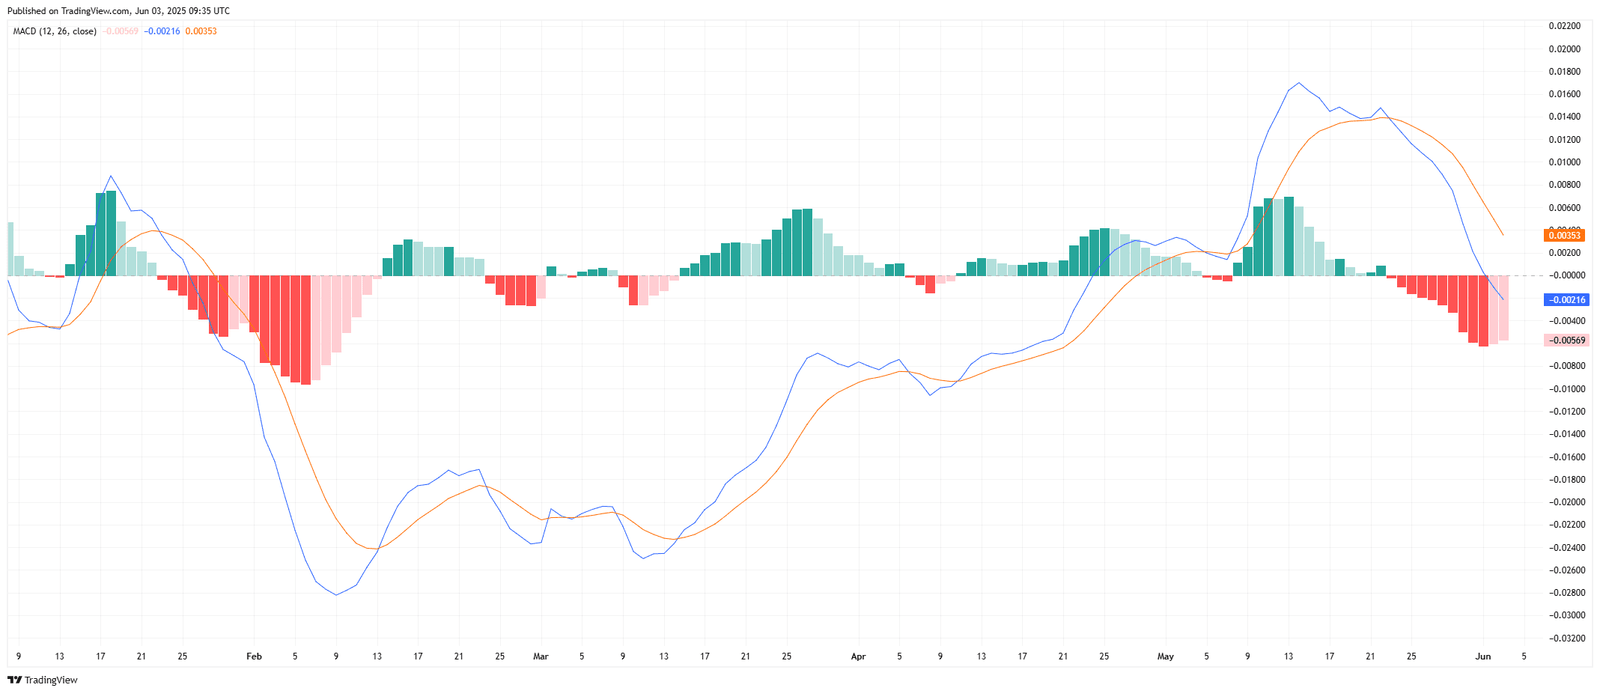
The MACD measures momentum and trend shifts by comparing the 12-period and 26-period exponential moving averages (EMAs). A bearish crossover occurs when the MACD line crosses below the signal line, suggesting a momentum reversal to the downside.
Currently, the histogram shows rising negative bars, confirming that bearish momentum is increasing. The last bullish wave peaked in May, but since then, both MACD and price have moved downward.
This bearish MACD crossover aligns with signals from other indicators like the Relative Strength Index (RSI) and the Directional Movement Index (DMI), further supporting the view that Dogecoin may break below the ascending channel and revisit lower support.
Dogecoin CMF Turns Negative, Confirms Capital Outflow
On June 3, 2025, the Chaikin Money Flow (CMF) indicator for Dogecoin (DOGE/USDT) dropped to –0.05, signaling a shift from mild accumulation to net capital outflow.
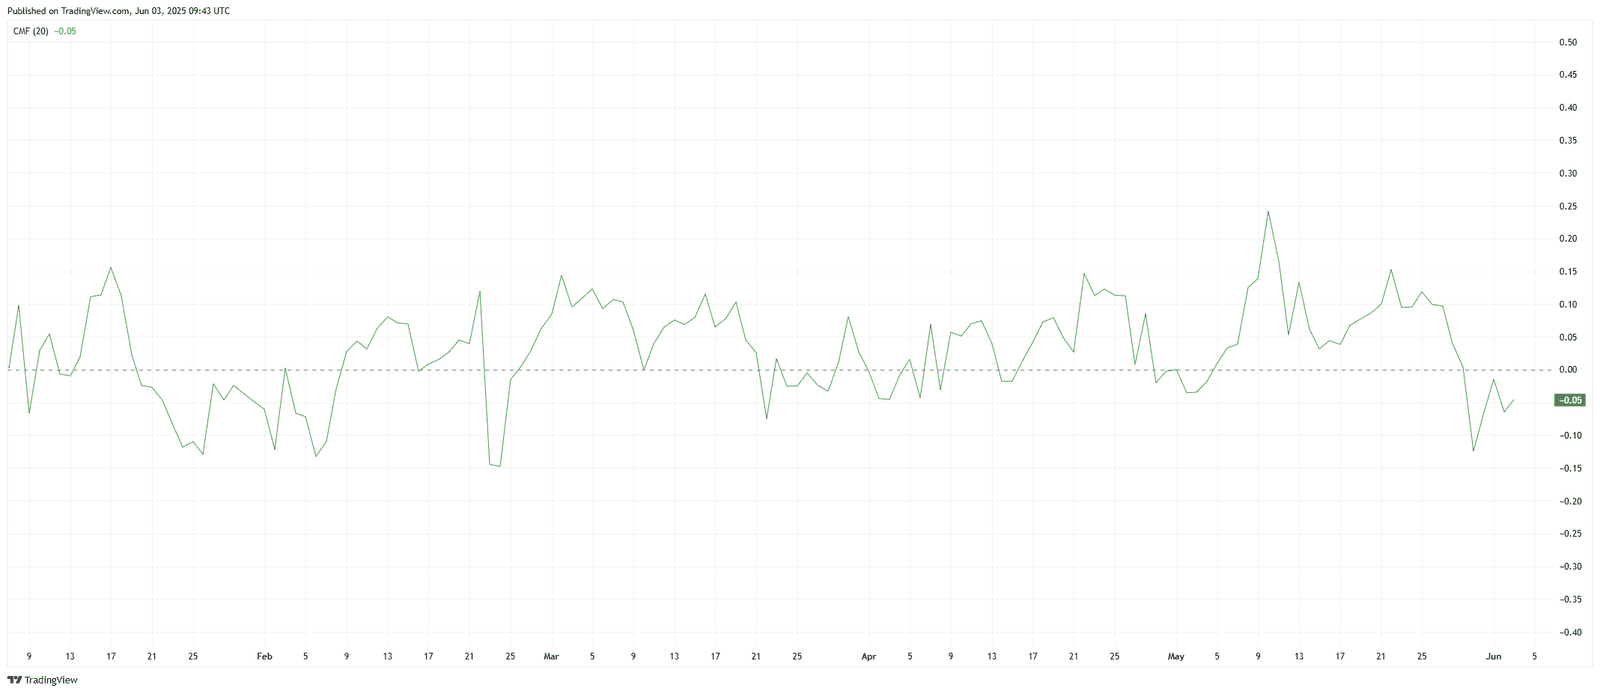
The CMF measures buying and selling pressure over a 20-period average, using both price and volume data. Values above 0 suggest capital inflow and buying interest, while values below 0 indicate capital outflow and selling pressure.
Dogecoin’s CMF had hovered near the neutral line throughout May but recently dipped below 0 as the price failed to hold upside momentum. This move confirms that distribution has begun, with sellers likely dominating current market activity.
This negative CMF reading supports other bearish signals across the chart setup, including the bearish MACD crossover and weakening RSI. If the indicator stays below 0 or drops further, it would strengthen the bearish case for a breakdown from the ascending channel pattern.
