
Cryptocurrency investment products recorded $3.75 billion in inflows during the trading week ending Friday, according to CoinShares. Ether exchange-traded products (ETPs) dominated, attracting $2.9 billion, while Bitcoin funds saw $552 million, or about 15 percent of the total.

The inflows came during a period when Ether (ETH) approached all-time highs near $4,700, reaching $4,268 on Thursday, based on CoinGecko data. However, both Bitcoin and Ether funds ended the week with outflows on Friday, as investor sentiment briefly shifted, SoSoValue reported.
Other altcoins also registered activity. Solana (SOL) attracted $176.5 million, while XRP gained $125.9 million. In contrast, Litecoin (LTC) recorded outflows of $0.4 million, and Toncoin (TON) lost $1 million during the same period.
Spot Bitcoin ETFs Lag Behind Ether ETFs
Despite Bitcoin (BTC) breaking above $124,000 on Wednesday, the inflows into Bitcoin ETFs remained modest compared to Ether. The total weekly inflows for Bitcoin stood at just over half a billion dollars, underscoring the growing demand for Ethereum-linked products.
According to SoSoValue, Bitcoin ETFs posted a seven-day inflow streak that gathered $1.3 billion in total. Ether ETFs outperformed with an eight-day streak, generating $3.7 billion since August 5. Earlier this year, Bitcoin saw a 15-day inflow run in June, while Ether had a 20-day streak in July, showing shorter runs now compared to past months.

The divergence highlights how Ether ETPs have recently taken a stronger role in driving overall fund activity, even as Bitcoin touched new price records.
Trading Volumes Hit New Weekly Record for Crypto ETFs
The surge in inflows coincided with record-breaking trading volumes. Bloomberg ETF analyst Eric Balchunas reported that spot Bitcoin and Ether ETFs combined reached $40 billion in trading volume after only four trading days last week.
“ETHSANITY: Ether ETFs weekly volume was about $17 billion, blowing away record, man did it wake up in July,”
Balchunas posted on X Friday, emphasizing Ether’s central role in the record figures.

Nate Geraci, president of NovaDius, also commented on X, noting that spot Ether ETFs “absolutely obliterated previous weekly trading volume record.” His remarks pointed to the strength of participation despite prior doubts in the market.

The latest inflows and volumes highlight how Ether ETPs are becoming a focal point of trading activity. While Bitcoin’s long-term role remains significant, Ethereum products have taken a larger share of investor interest in recent weeks.
Ethereum Daily Chart Analysis – August 18, 2025
This Ethereum (ETHUSD) daily chart, created on August 18, 2025, shows how price action developed through the summer. A clear falling wedge pattern formed in late July. A falling wedge is a bullish technical pattern where price declines within converging trendlines, but momentum typically builds for an upward breakout once resistance is broken.

Ethereum broke out of this wedge in early August, and the move was sharp. From the breakout point, the price surged by nearly 31 percent, confirming the bullish nature of the setup. The rally pushed ETH close to its prior high near $4,700, but sellers stepped in and the market corrected. At the time of this chart, ETH has already retraced about 12 percent from the local top, showing the weight of profit-taking.
Despite this correction, the structure of the chart still supports an upward bias. From the current trading level around $4,261, the measured move projection of the wedge points to another 29 percent increase, which would bring Ethereum toward $5,470. This target aligns with the marked horizontal resistance zone, reinforcing the idea that technical traders are watching that level closely.
The 50-day exponential moving average (EMA), currently at $3,652, continues to act as dynamic support. The distance between spot price and the EMA shows that momentum remains strong, even with the recent dip. In addition, trading volume expanded during the breakout phase, confirming buying strength.
Overall, the chart demonstrates a classic sequence of breakout, rally, and correction within a bullish continuation pattern. While short-term pressure has created a pullback, the broader outlook still points upward, with $5,470 remaining the key technical target from this formation.
Ethereum RSI Analysis – August 18, 2025
This Ethereum Relative Strength Index (RSI) chart, created on August 18, 2025, shows the momentum shifts through the past year. The RSI is a momentum indicator that measures the strength of price movements on a scale from 0 to 100. Traditionally, levels above 70 suggest overbought conditions, while levels below 30 suggest oversold conditions.
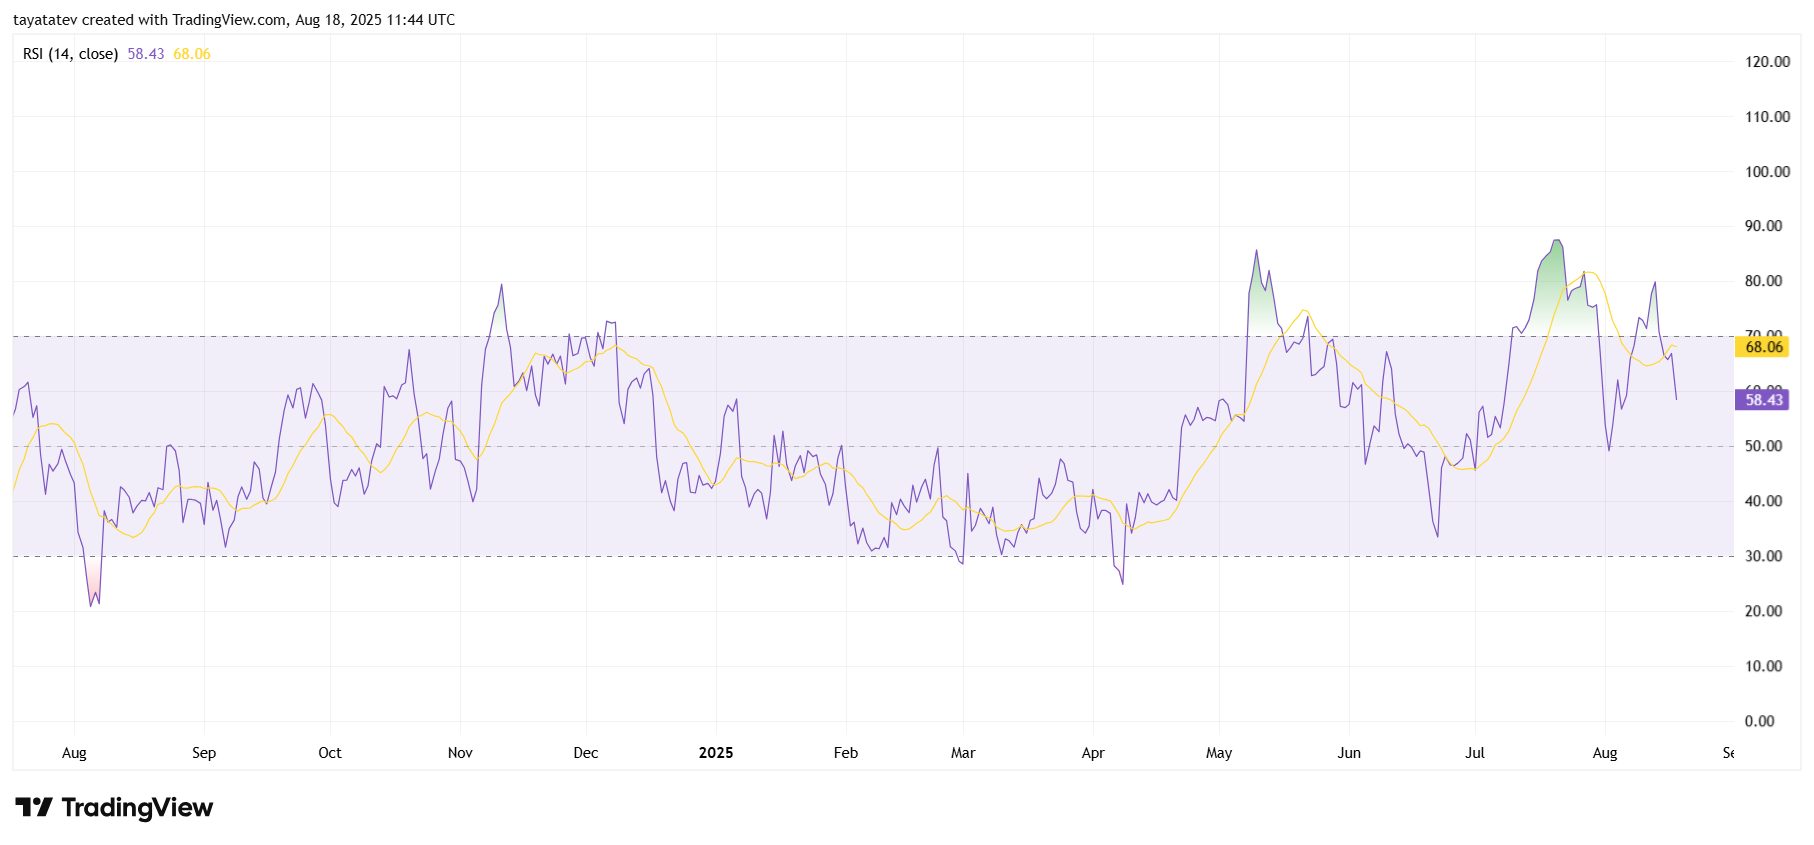
In recent weeks, the RSI climbed above 80 in early August, which placed Ethereum in overbought territory. This move coincided with the sharp rally that followed the falling wedge breakout. Once the RSI crossed above 70, it confirmed strong bullish momentum, but it also signaled risk of a near-term pullback. As shown on the chart, the correction arrived quickly, with RSI sliding back to the current reading of 58.43.
The RSI is now in neutral territory, between 40 and 70, where momentum neither favors buyers nor sellers strongly. The moving average of the RSI, shown in yellow, currently stands at 68.06, still above the spot RSI level. This indicates that momentum has cooled down after the surge but remains elevated compared to mid-year readings.
Throughout 2025, RSI patterns show repeated cycles where Ethereum shifted from oversold levels in the 30s to strong overbought peaks near 80 or higher. The latest peak in August resembles the May move, when ETH also corrected after RSI pushed above 80. The similarity suggests the market has entered another cooling phase rather than a deep reversal.
For now, Ethereum’s RSI confirms that the asset has worked off extreme buying pressure. With RSI holding above 50, momentum remains positive, though not overheated. This level supports the view that Ethereum still has room to move higher without immediately reaching overbought conditions again.
