
Ether’s price displayed resilience on Wednesday, holding support near $4,070 after a six-day, 15.1% slide. The drop erased $817 million in leveraged long positions, yet it did not spark a broad bearish shift. Instead, derivatives data indicates traders remain composed, keeping the path toward $4,700 in play.
Futures Market Signals Confidence
ETH’s six-month futures premium stayed above the neutral 5% threshold during the decline, showing traders’ confidence. Futures contracts usually trade higher than spot prices to reflect settlement delays. However, the last strong bullish signal from this metric appeared in January. Even the 100% rally between July 1 and Aug. 13 failed to restore full optimism, highlighting cautious sentiment in derivatives markets.

Macroeconomic conditions add to hesitation. US inflation continues above the Federal Reserve’s 2% target, while growth indicators remain uneven. The Nasdaq Composite dropped for a second consecutive session on Wednesday, dragged down by concerns over inflated valuations in artificial intelligence stocks.
Traders also reduced positions ahead of Fed Chair Jerome Powell’s remarks scheduled for Friday. Carol Schleif, chief market strategist at BMO Private Wealth, noted,
“If Powell’s language is more hawkish, that could pressure tech stocks even further.”
At the same time, retailer Target’s weaker earnings signaled broader profitability concerns.
Options Market Stays Neutral
ETH options data also reflects balance. The 30-day delta skew at Deribit shows a 4% reading, indicating equal demand for put and call protection. This neutral stance suggests traders are not overly committed to either downside or upside bets. Still, the lack of stronger optimism after ETH briefly reached $4,700 reveals reluctance to call for a new all-time high.
Ethereum’s onchain data provides a more positive outlook. According to DefiLlama, the network controls around 60% of the total value locked (TVL) across blockchains. At the same time, demand for Ethereum blockspace is rising.
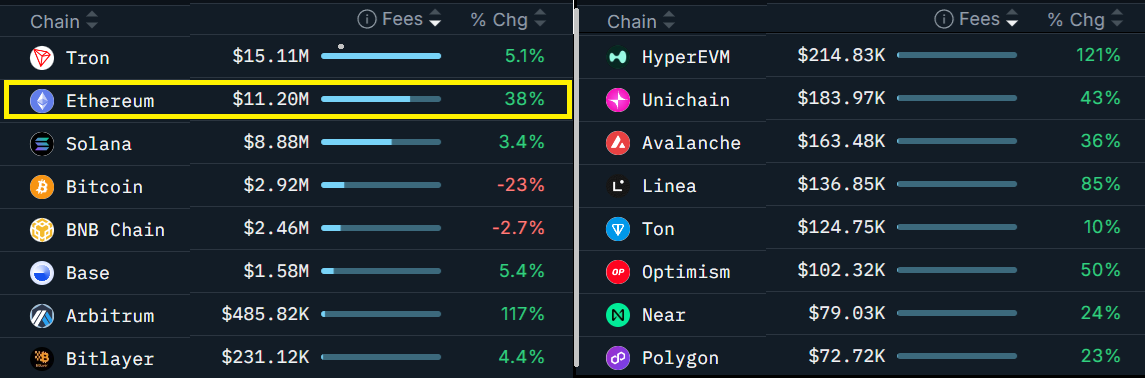
Nansen data shows Ethereum’s 7-day fees jumped 38% to $11.2 million on Wednesday. In contrast, Solana’s fees rose just 3% while BNB Chain revenues fell 3%. Ethereum also led decentralized exchange volumes with $129.7 billion traded over the past 30 days, reinforcing its dominance.
While derivatives highlight caution, the stance aligns with the wider crypto market correction rather than Ethereum’s fundamentals. Global risks, including potential US import tariffs, continue to drive risk aversion across markets.
Ether’s ability to reclaim $4,700 depends on easing investor fear tied to the economy. Still, the absence of panic in derivatives markets and growing onchain activity suggest ETH’s recovery stands on firmer ground than many expected.
Ethereum Bullish Flag Setup Signals Potential Breakout
The Ethereum ETH/USD chart on the one-hour timeframe shows a clear bullish flag pattern. Price rallied sharply to $4,700 on August 13, followed by a descending channel that corrected the move. This consolidation remained contained within parallel trendlines, with price bouncing between support and resistance. On August 21, ETH broke above the upper boundary of this channel, suggesting the flag pattern has been activated.
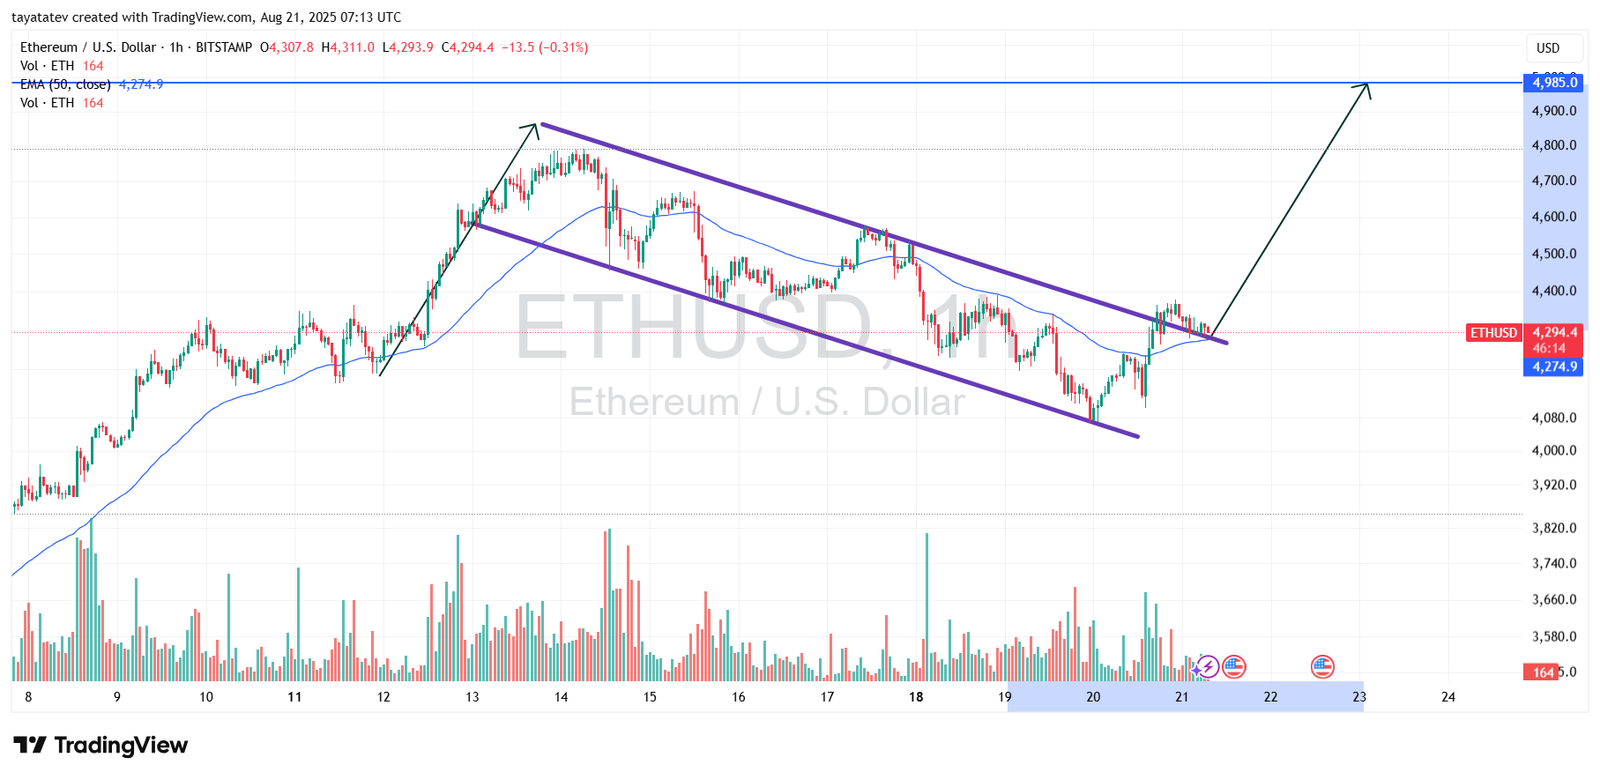
A bullish flag represents a continuation formation in technical analysis. It begins with a steep upward move, known as the flagpole, followed by a controlled pullback that resembles a downward-sloping rectangle or channel. The breakout above the flag’s resistance typically confirms a resumption of the prior trend, projecting gains equal to the height of the flagpole.
At present, ETH trades near $4,294 while the flagpole extends roughly $700. Applying this measured move signals a potential 15 percent rally from the breakout point. If confirmed, Ethereum could target approximately $4,985 in the coming sessions. The breakout also aligns with support from the 50-period exponential moving average, which sits just below the breakout zone, reinforcing the validity of this setup.
Momentum indicators and trading volume confirm market interest. Volume spiked at the point of breakout, reflecting fresh buying activity. At the same time, the sustained higher lows in price action during consolidation show traders avoided aggressive selling. This combination strengthens the bullish outlook and supports the case for ETH advancing toward $4,985.
In conclusion, the bullish flag breakout points to Ethereum continuing its recovery after the mid-August correction. A decisive close above $4,300 would further validate the setup, positioning ETH for a potential run to $4,985.
Ethereum RSI Signals Neutral but Strengthening Momentum
The Ethereum (ETH) chart shows the Relative Strength Index (RSI) on the 14-period setting. At the latest reading, RSI stands near 57, moving slightly above the neutral 50 line. This level indicates neither extreme bullishness nor bearishness but reflects improving momentum compared to the sub-40 levels seen during the mid-August decline.

RSI measures the speed and magnitude of price changes to assess whether an asset is overbought or oversold. Values above 70 typically suggest overbought conditions, while levels below 30 highlight oversold markets. ETH’s current position around 57 shows buyers gradually regaining control without pushing into overheated territory. This middle zone often supports continued trend development when combined with a broader bullish setup, such as the flag breakout pattern observed earlier.
The moving average plotted alongside the RSI adds confirmation. The RSI line remains above its short-term average, reflecting positive momentum. The recent crossover from below also suggests a potential continuation of the upward trajectory. This aligns with Ethereum’s price recovery toward the $4,300 level, reinforcing the case for a possible move toward $4,985 if momentum persists.
In summary, Ethereum’s RSI points to a strengthening but balanced market. The indicator does not show exhaustion, leaving room for further gains. When paired with the bullish flag breakout on price charts, the RSI reading supports the probability of ETH extending its rally.
