
Ethereum (ETH) hasn’t had the same kind of breakout year as Bitcoin. While BTC blasted through multiple all-time highs in 2025—most recently topping $110,000—ETH has been stuck in a tight $2,500–$2,700 range for weeks.
But that could soon change.
ETH’s lag is due to a few key pressures: persistent resistance near $2,800, lower post-Dencun fee revenue, and a slower ETH burn rate. These factors have capped upside momentum, even as fundamentals remain solid. On-chain activity is holding steady, staking continues to grow, and the upcoming Pectra upgrade—designed to improve scalability and validator efficiency—has started drawing attention.
Moreover, according to CoinShares data, ETH investment vehicles have enjoyed five consecutive weeks of inflows. Meanwhile, Ethereum’s on-chain data shows rising whale accumulation and a steady drop in exchange-held ETH, both strong signals of growing institutional conviction. Futures market positioning also remains far from euphoric levels, hinting that Ethereum may have more room to run.
As such, ETH traders remain optimistic about the token’s price action in the coming days.
On-Chain Metrics Confirm Ethereum’s Accumulation Phase
Ethereum’s on-chain footprint suggests that its consolidation is not random—it’s accumulation. Data from Glassnode and CryptoQuant confirms this. Whales are adding to positions, exchange balances are falling, and leverage has not yet peaked. Together, these factors support a bullish continuation, provided momentum remains intact.
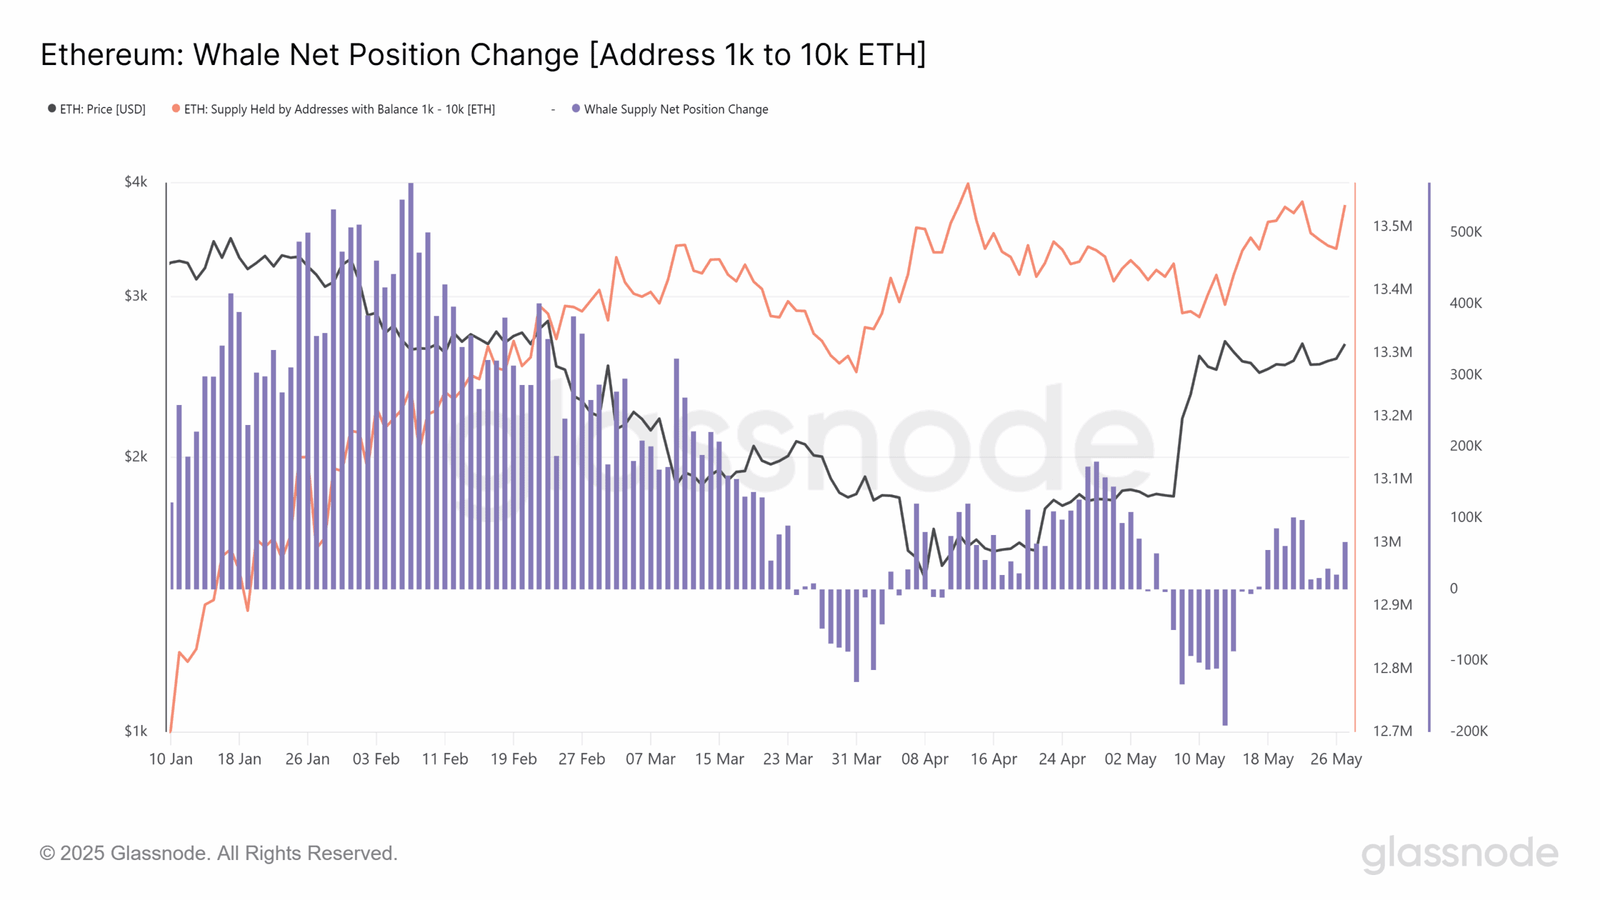
Glassnode’s Whale Net Position Change chart tracks wallet cohorts holding between 1,000 and 10,000 ETH. After a period of consistent selling from mid-March to early April, whales flipped to accumulation by mid-April. ETH supply held by these addresses rose from 12.8 million to 12.9 million by late May.
While minor distribution reappeared in recent days, the overall trend remains positive. This accumulation during a sideways market phase typically signals firm conviction ahead of upward price expansion.

CryptoQuant’s Exchange Netflow chart supports this. ETH has consistently exited exchanges since mid-April. Sustained outflows indicate declining sell-side pressure. Fewer tokens available on centralized platforms reduce the likelihood of forced selling while also pointing to growing long-term holding behavior. The volume of recent outflows may not match January’s intensity, but the trend direction matters.
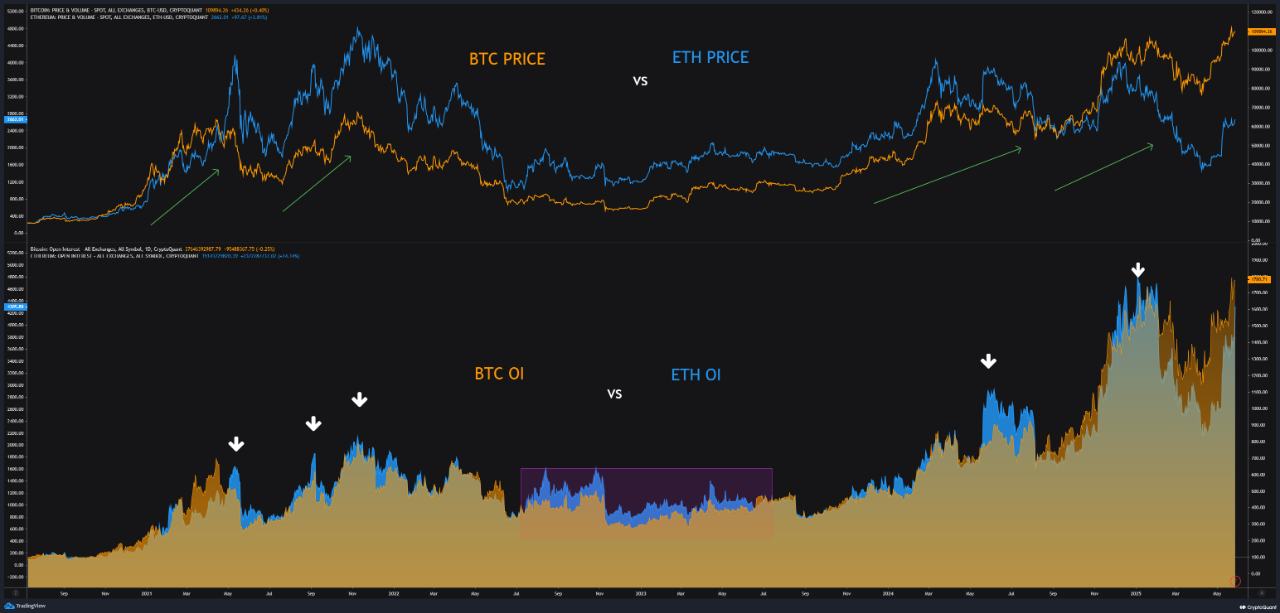
The final layer is futures positioning. As of late May 2025, Ethereum’s open interest remains below Bitcoin’s, signaling that the current market cycle has not yet reached euphoric conditions. An analyst, elcryptotavo, shared on CryptoQuant that every instance where ETH OI surpassed BTC OI has aligned with major market tops, making this a critical signal to monitor.
At the same time, retail trading activity is climbing but hasn’t hit “too many retail” territory, according to the analyst. These conditions suggest the rally is still in its expansion phase. Until these metrics flip into excess, Ethereum likely has further room to climb, reinforcing the bullish outlook from technical and on-chain perspectives.
Bullish Technical Setup Could Attract Buyers
Ethereum (ETH) continues to consolidate within a bull flag formation, defined by a tight range after a sharp vertical rally in April. The structure consists of a downward-sloping consolidation channel. This type of pattern typically follows a strong upward impulse and indicates potential for continuation, if the price confirms with a breakout.
Traders calculate the pattern’s projected target by measuring the height of the flagpole and projecting it upward from the breakout point. As such, the technical setup could see ETH price theoretically climbing to $3,950 once it breaks out.
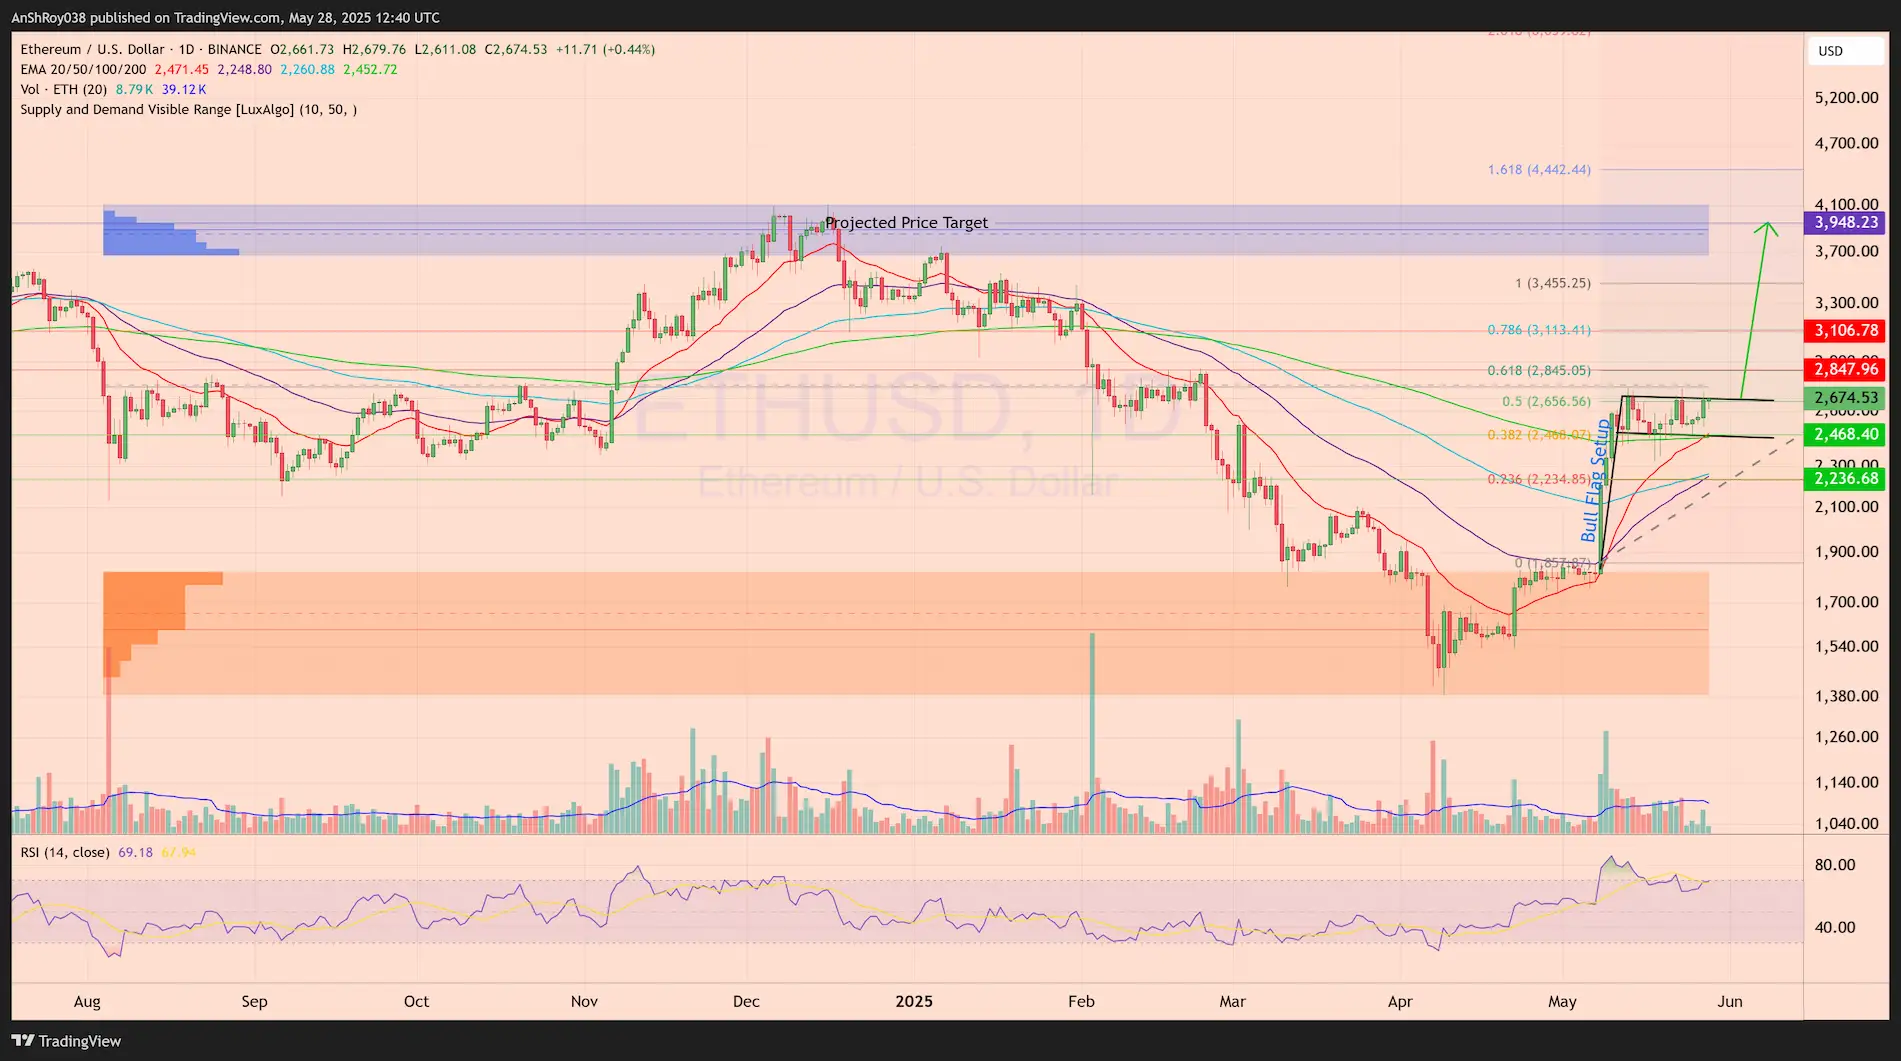
ETH remains range-bound for now, but structural momentum continues to build. The 20-day EMA has crossed above the 200-day EMA, forming a golden cross. Simultaneously, the 50-day EMA is nearing a crossover with the 100-day EMA, adding another layer of momentum confirmation. Breaking out of the pattern would allow the ETH price to flip the immediate resistance near $2,850, before targeting the resistance near $3,100
Traders should monitor RSI, currently near overbought levels with a score of 69.18, and look for a clean close above resistance before confirming any continuation setup. A downtrend would deposit ETH price to the pattern’s support near $2,468. Breaching the immediate support could drag ETH back toward the 0.236 Fib support near $2,236, invalidating the bullish structure.
