Ethereum (ETH) is holding firm above $3,800 after a sharp July surge, with bulls now eyeing a clean break past the psychological $4,000 level. The token’s recovery put ETH price near levels last seen in Dec. 2024, taking Ethereum’s YTD gains to 14%.
The recovery has fueled renewed comparisons to a historic breakout in traditional markets, with analysts noting that ETH’s current trajectory mirrors a similar multi-wave structure that once preceded a parabolic rally on the Dow Jones (DJIA) price chart.
That setup could now play out again on Ethereum’s bi-weekly chart.
ETH’s Expanding Diagonal Mirrors DJIA’s Historical Pattern
Technical analyst Gert van Lagen has drawn parallels between Ethereum’s current market structure and a historical breakout in the Dow Jones Industrial Average (DJIA) from the 1980s.
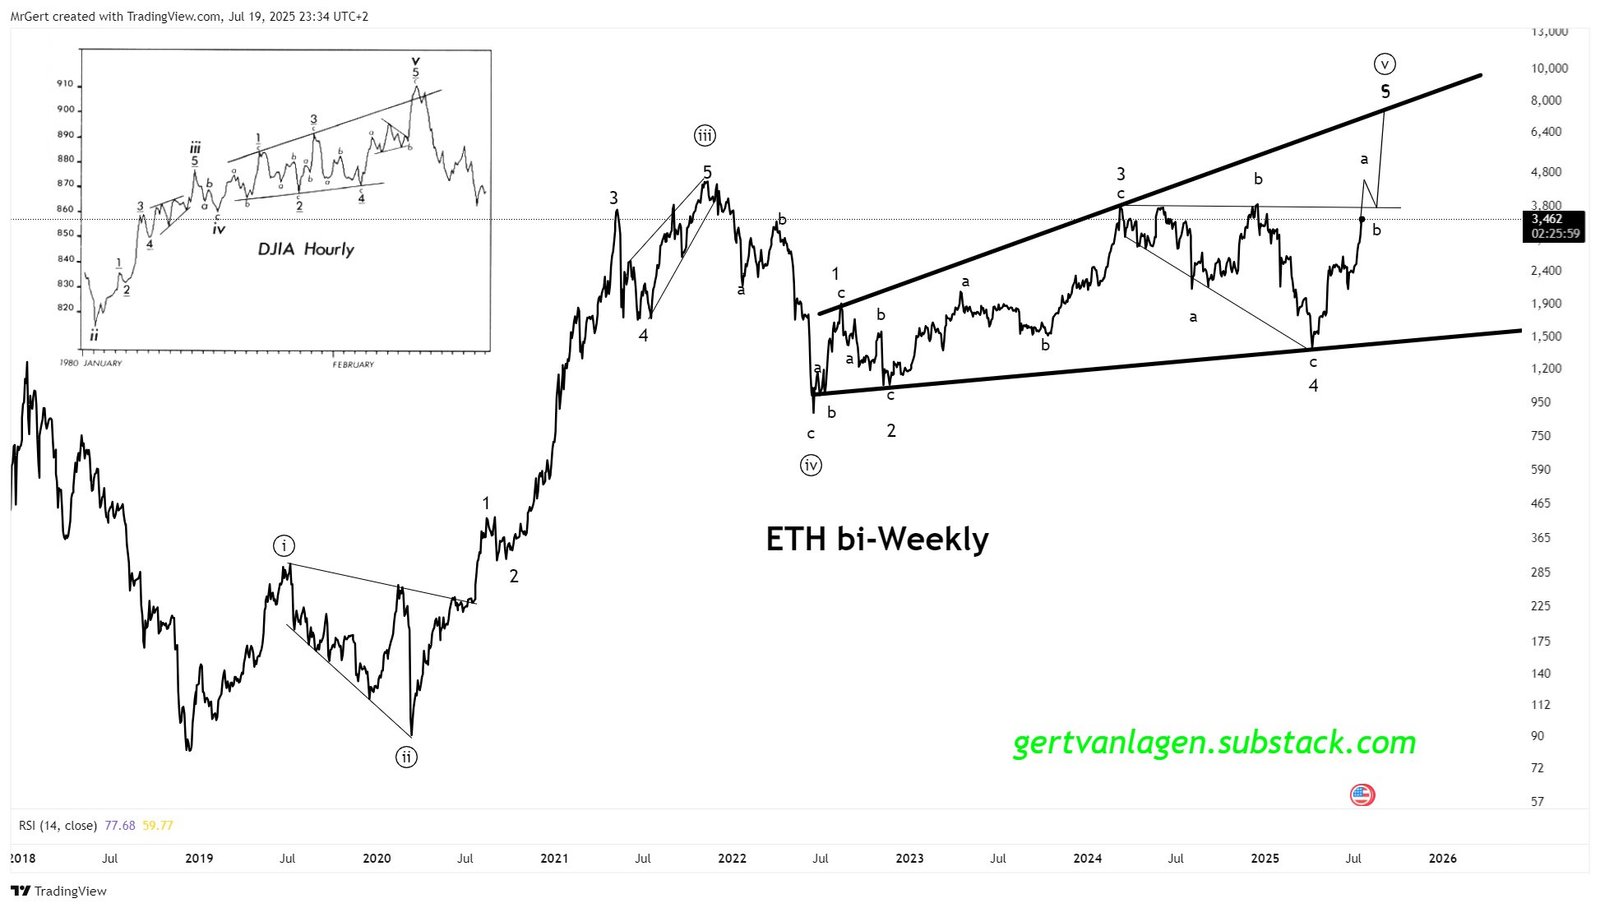
According to his bi-weekly chart, ETH is completing a five-wave Elliott cycle that began in 2019. The final segment—Wave v—is now unfolding as an expanding diagonal, a pattern historically associated with exhaustion-driven price spikes.
Van Lagen argues that each subwave within this structure has remained corrective, aligning with textbook Elliott Wave mechanics. According to the analyst, Ethereum has already completed Wave 4 and entered the final upward leg, which is subdividing into three waves labeled a–b–c. The token appears to be midway through subwave b, likely setting up for a retest of the upper boundary of the megaphone structure before an aggressive breakout via Wave c.
The analyst referenced the DJIA’s earlier five-wave expansion, where the final “blow-off” wave closely resembled ETH’s current path. In that instance, the index completed its run with a sharp vertical rise after a brief consolidation—mirroring what van Lagen expects to see in Ethereum’s chart.
He places the potential top of Wave v near the $8,000 mark, contingent on a clean continuation of the expanding wedge. If Ethereum follows the same trajectory, the token may enter its six-year bull cycle’s final—and most explosive—phase. However, van Lagen has not specified a timeline, focusing strictly on structural similarities.
Analysts Align With Long-Term Surge Thesis
While van Lagen focuses on structural similarity with historical market blow-offs, other analysts reinforce the bullish narrative through breakout validation and statistical precedent.
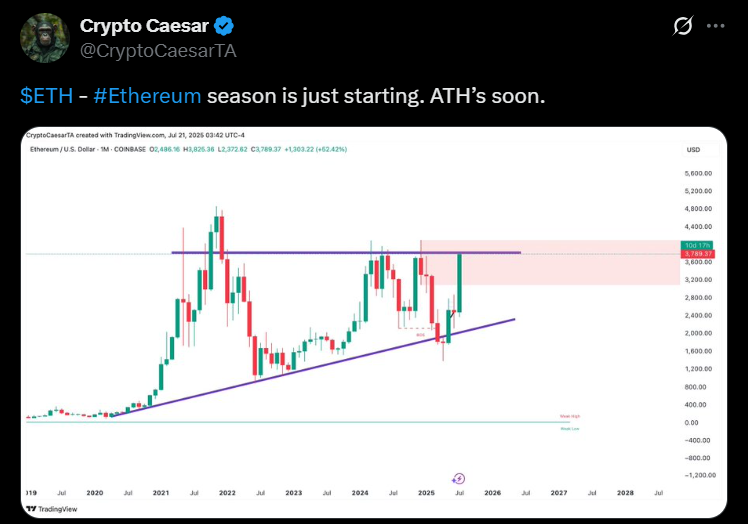
Crypto Caesar highlighted Ethereum’s monthly structure, showing a sustained ascending trendline from 2020 and multiple rejections at the $3,900–$4,000 range. In an X post, the analyst highlighted that ETH has broken into this resistance band again.
He argued that the repeated tests combined with higher lows indicate compression toward a breakout. The analyst stated that a move beyond $4,000 could confirm long-term continuation, per van Lagen’s expanding diagonal thesis.
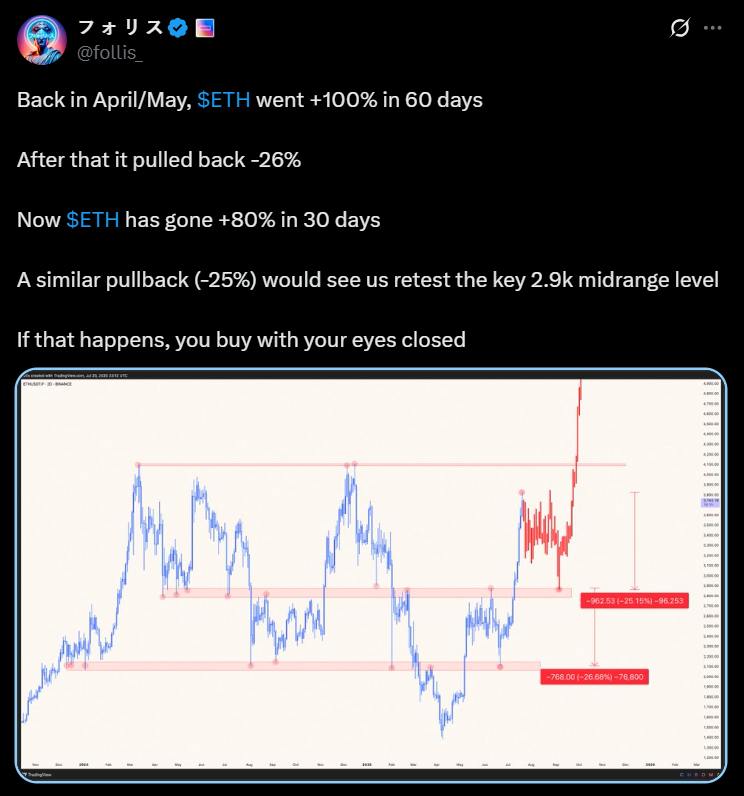
Meanwhile, X-based trader Follis took a data-driven approach. He pointed out that Ethereum gained 100% in 60 days earlier this year, followed by a 26% pullback. With ETH rising 80% in just 30 days, he expects a short-term correction of 25% toward the $2,900 zone before any final push higher.
The analyst’s thesis does not contradict van Lagen’s but instead frames a potential b-wave retest within the broader wave structure.
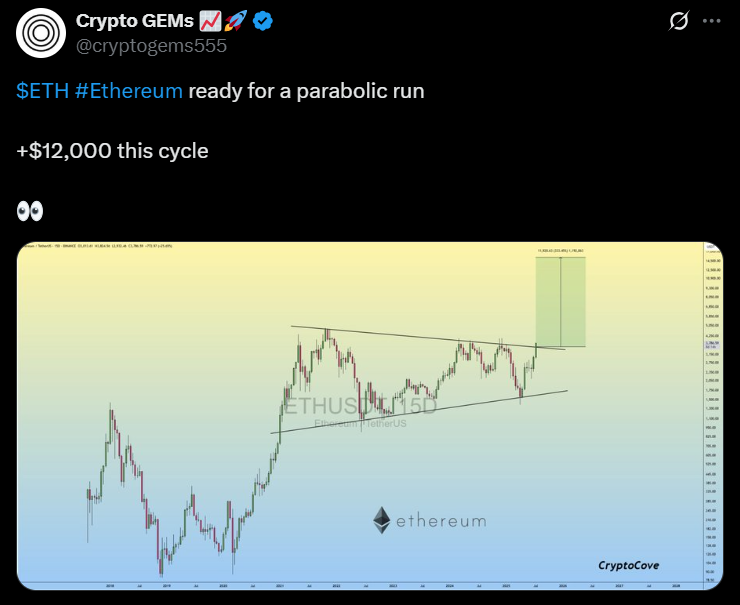
Moreover, the prediction of X-based trader Crypto GEMs pushed the ETH price’s upper boundary further. The trader projected a $12,000 target based on a symmetrical triangle breakout visible on ETH’s multi-year 1D chart, though the token is yet to confirm the breakout.
However, Gems’ projection lacks a clear time horizon but, in spirit, matches van Lagen’s wave c breakout target, albeit more aggressively.
Together, the analysts paint a consistent picture for ETH’s future price. Ethereum is preparing for or already inside its final breakout wave. The conviction varies, but the underlying structure remains broadly aligned.
