
Ethereum price surged 45% over the past week, recovering the key $2,200 to $3,900 macro range it lost earlier in March. The ETH token rebounded from its April low of $1,380 and gradually moved toward $1,800 before breaking out. It then climbed above the $2,000 resistance and reclaimed the $2,100 and $2,300 levels.
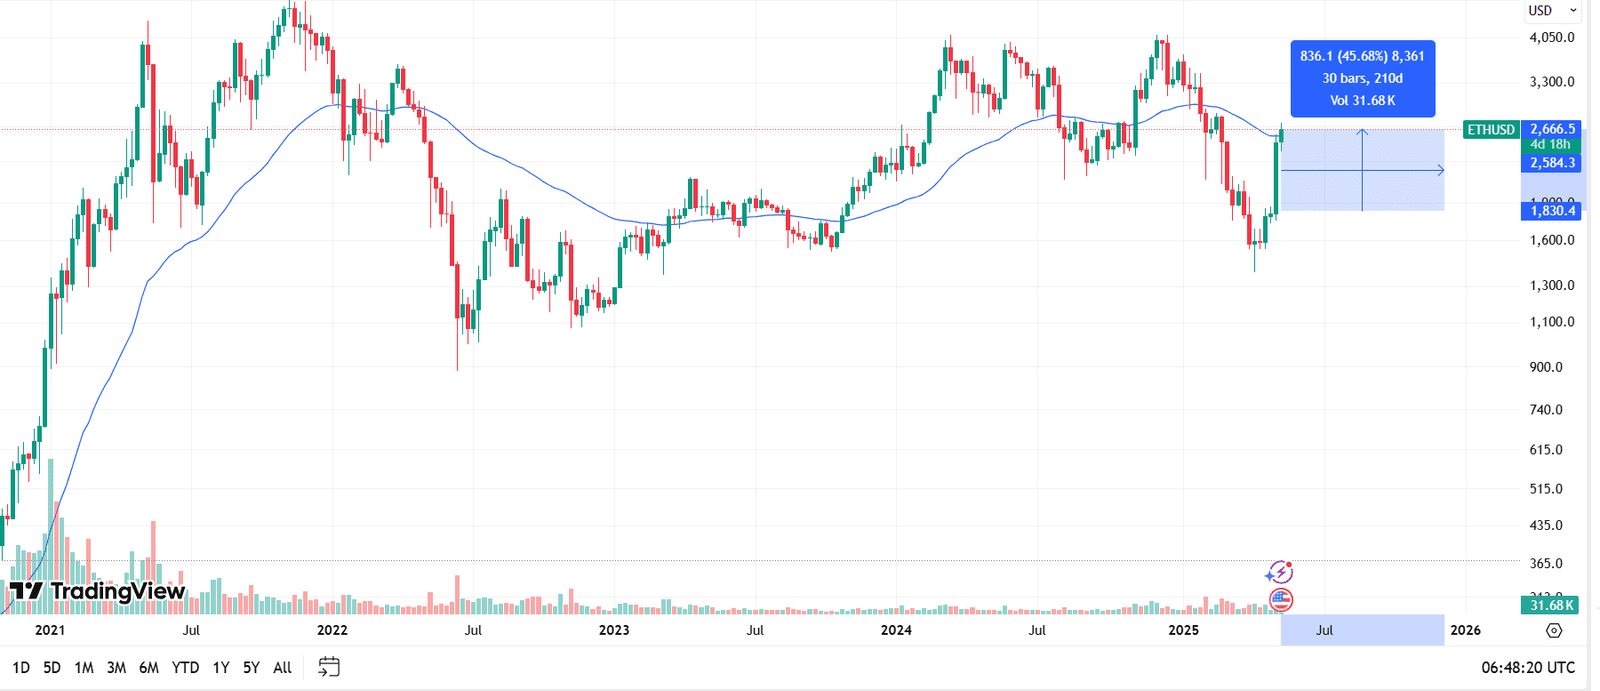
As of May 14, 2025, Ethereum price trades at $2,666 after rising above its 50-week Exponential Moving Average (EMA), currently at $2,584. The recent breakout follows a steady recovery from the 2025 low near $1,380. Ethereum has now gained 45.68% over the past 30 weekly candles, or 210 days, based on TradingView data. This move confirms that Ethereum has reclaimed a key technical level not held since mid-2023.
Castillo Trading, a market analyst, said Ethereum is “doing exactly what it should be. Taking some time to build a base at important levels before the next move.”
Ethereum Price Holds Between $2,400 and $2,700
Ethereum price currently moves within a narrow range between $2,400 and $2,700, according to the 4-hour chart from BitMEX. After breaking past key resistance near $2,300, the ETH token surged and reached a peak at $2,652. However, it failed to hold above that level and has since moved sideways.
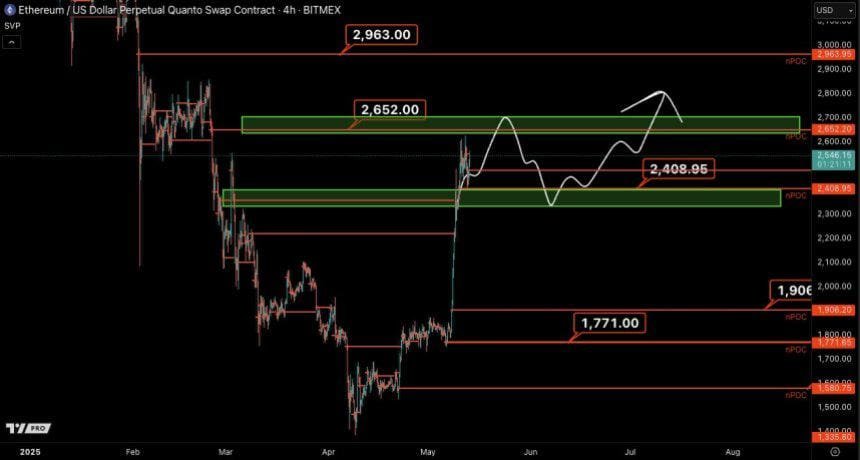
The chart shows a short-term consolidation area forming between $2,408 and $2,652. This zone acts as both a support and resistance range, highlighted in green. Ethereum price is testing this area repeatedly, suggesting indecision among traders. As long as the price remains inside this range, Ethereum is likely preparing for the next large movement.
Market analyst Castillo Trading described the behavior as “some shakeouts in both directions.” This refers to short-term price spikes or drops that occur before a clearer trend forms. On the chart, this is illustrated by the white curved line showing potential volatility. These shakeouts can trap buyers and sellers if they respond too early to fake breakouts.
Mid-Term Targets Appear Near $2,963 and $2,408
If Ethereum price breaks above the $2,652 upper resistance, the next target could be the $2,963 level. This area represents the high from February, marked in red at the top of the chart. That zone previously acted as strong resistance, and Ethereum failed to hold it during past rallies.
On the other hand, if ETH drops below $2,408, support could come into play. This price marks the lower bound of the current green range and is close to a previous demand area. If the price fails here, the next major support sits at $1,771. This lower level served as a base for Ethereum’s recent breakout and is also shown in red on the chart.
For now, Ethereum trades just below the midpoint of the $2,400–$2,700 zone. The price shows no clear breakout yet, and trading volume has slightly decreased, signaling a cooling phase. However, this pause often occurs after large moves, giving the market time to form stronger support levels.
Traders Monitor Key Support Levels Below $2,400
The chart highlights several lower support zones that may attract attention if Ethereum fails to hold the current range. The $1,900 level is marked in red, just above the March low. Below that, $1,771 stands out as a major pivot zone. Ethereum built a strong base here before the May breakout.
Any drop to these lower levels would erase much of the recent gains. However, the current consolidation suggests Ethereum is testing the strength of recent support. If it can build a solid base between $2,400 and $2,652, then a move toward $2,850 or higher becomes more likely later.
Traders continue watching the ETH token closely as it fluctuates within this defined range. The market shows no strong direction yet, but the tight structure between green and red zones helps identify the next potential breakout or breakdown.
Daan Crypto Trades Flags Key $2,500 Zone for Ethereum, Highlights Fibonacci-Based Buy Areas
Ethereum price trades near $2,486, as shown on the 1-day chart shared by analyst Daan Crypto Trades. The chart, based on Binance data, shows Ethereum recently surged from $1,755 to a local high of $2,624 in early May. After this sharp move, the ETH token has stabilized around the $2,500 zone.
This level matches a previous horizontal resistance from early March. Ethereum now tests this level from above, trying to establish it as new support. The hand-drawn projection on the chart suggests the price may briefly dip before forming a higher low and potentially rising again toward $2,621.
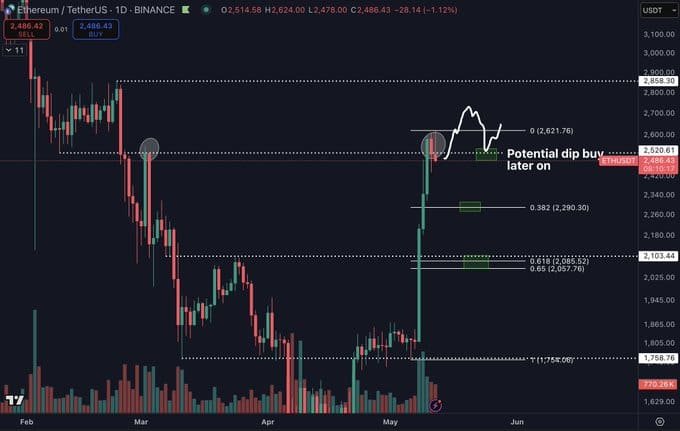
The chart outlines two key support areas using Fibonacci retracement levels. These zones are marked with green rectangles, positioned around standard retracement points. The 0.382 Fibonacci level is at $2,290.30, and the 0.618 level sits near $2,057.76.
In his post, Daan Crypto Trades noted:
“Currently ETH is at an important level. If it loses this area we might visit one of those green boxes below.”
These green areas represent zones where price could bounce if Ethereum breaks below $2,500. They align with historical consolidation zones and may provide dip-buying opportunities.
He also added:
“In that case you can simply wait for a consolidation to be formed at those levels and don’t knife catch either.”
This refers to waiting for Ethereum to settle into a stable pattern at those levels instead of entering during a sharp decline.
ETH May Retest Horizontal Level If Price Holds
If Ethereum stays above the current zone, it could flip this level into support. Daan Crypto Trades mentioned:
“Alternatively, if price keeps going up, maybe the current level will become a nice retest of the horizontal.”
This would suggest that Ethereum may continue higher while using the $2,500 zone as a base. In this scenario, a move toward the $2,621 area becomes likely. The marked projection shows a higher low setup, which often acts as a signal for a trend continuation.
Ethereum remains above the 0.236 retracement level, showing some resilience. However, a breakdown below $2,486 could push the price into the $2,290 or $2,057 zones, aligning with the Fibonacci targets and the green zones on the chart.
Volume spikes during the early May breakout show strong interest around the $2,400–$2,600 range. Traders now watch whether Ethereum can hold this level or whether a deeper retracement occurs toward the lower support levels.
Ethereum Weekly Close at $2,514 Signals Range Recovery, Says Rekt Capital
Ethereum price closed the week at $2,514, according to a chart shared by analyst Rekt Capital on May 13, 2025. This weekly close confirms that Ethereum has reclaimed its macro range between $2,200 and $3,900. The ETH/USD weekly chart from Bitstamp shows that this move brought the price directly on top of a previously marked cluster zone, highlighted with a blue circle.
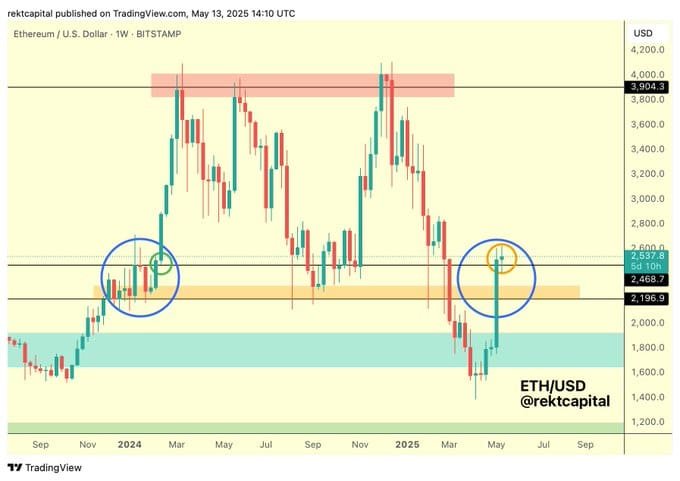
This same area acted as support during early 2024 before ETH surged past $3,900. Rekt Capital notes this similarity, suggesting a small dip near $2,468 could mirror the green-circled retest seen last year. That earlier move led to a major rally. Now, Ethereum is testing the same structure from above, indicating a possible repeat of that pattern if the level holds.
Scenario One: $2,468 Holds, Minor Dip May Follow
Rekt Capital wrote:
“What’s interesting is that Ethereum’s recent Weekly Close has actually occurred on top of the blue circled cluster. Thus, there is a scenario where just a small dip would suffice, if the green circled retest repeats here at ~$2468 (black).”
This would suggest a short dip followed by price stability and continuation. The orange circle drawn on the chart reflects this outcome, where Ethereum slightly retraces but holds above the reclaimed range before attempting another push higher. This setup would solidify $2,468 as support, validating the reclaim.
Rekt Capital emphasized that this scenario depends on Ethereum maintaining current levels. A breakdown below $2,468 would invalidate the smaller retest possibility.
Scenario Two: $2,468 Breaks, 10%–15% Drop Possible
The alternative scenario points to a deeper correction. Rekt Capital continued:
“If that level is lost however then the blue circled retest would become the dominant perspective.”
The chart’s blue circle near $2,200 highlights a larger support base that previously acted as a springboard during the 2024 recovery. If Ethereum drops to this zone again, it would represent a 10%–15% decline from current prices.
This second cluster area includes another CME (Chicago Mercantile Exchange) gap between $2,100 and $2,200. The zone is also part of a long-standing support region, marked in light orange. Ethereum has tested this level multiple times over the past year, making it a historically important area.
Rekt Capital previously noted that Ethereum already filled the March CME gap between $2,530 and $2,630. Two more gaps remain open at $2,300 to $2,400 and $2,100 to $2,200. The lower one is labeled as a Weekly CME Gap, which usually attracts more price activity.
Macro CME Gap Between $2,900 and $3,350 Remains Unfilled
While the current focus stays on $2,468 and $2,200, the chart also shows a large unfilled CME gap between $2,900 and $3,350. This range marked both resistance during the Q3 2024 pullback and the start of a breakout in Q4.
If Ethereum reclaims momentum, the upper gap could become relevant again. For now, Ethereum trades just above $2,500, holding a key level that may determine its direction over the next few weeks.
Ethereum Price Holds Above Weekly EMA With RSI Showing Renewed Strength
Ethereum price has climbed to $2,666.30, according to the 1-week chart from Bitstamp. The latest move has pushed the ETH/USD pair above the 50-week Exponential Moving Average (EMA), now positioned at $2,584.20. A weekly close above this level would mark a significant technical shift, as Ethereum has struggled to stay above this moving average for most of 2024 and early 2025.
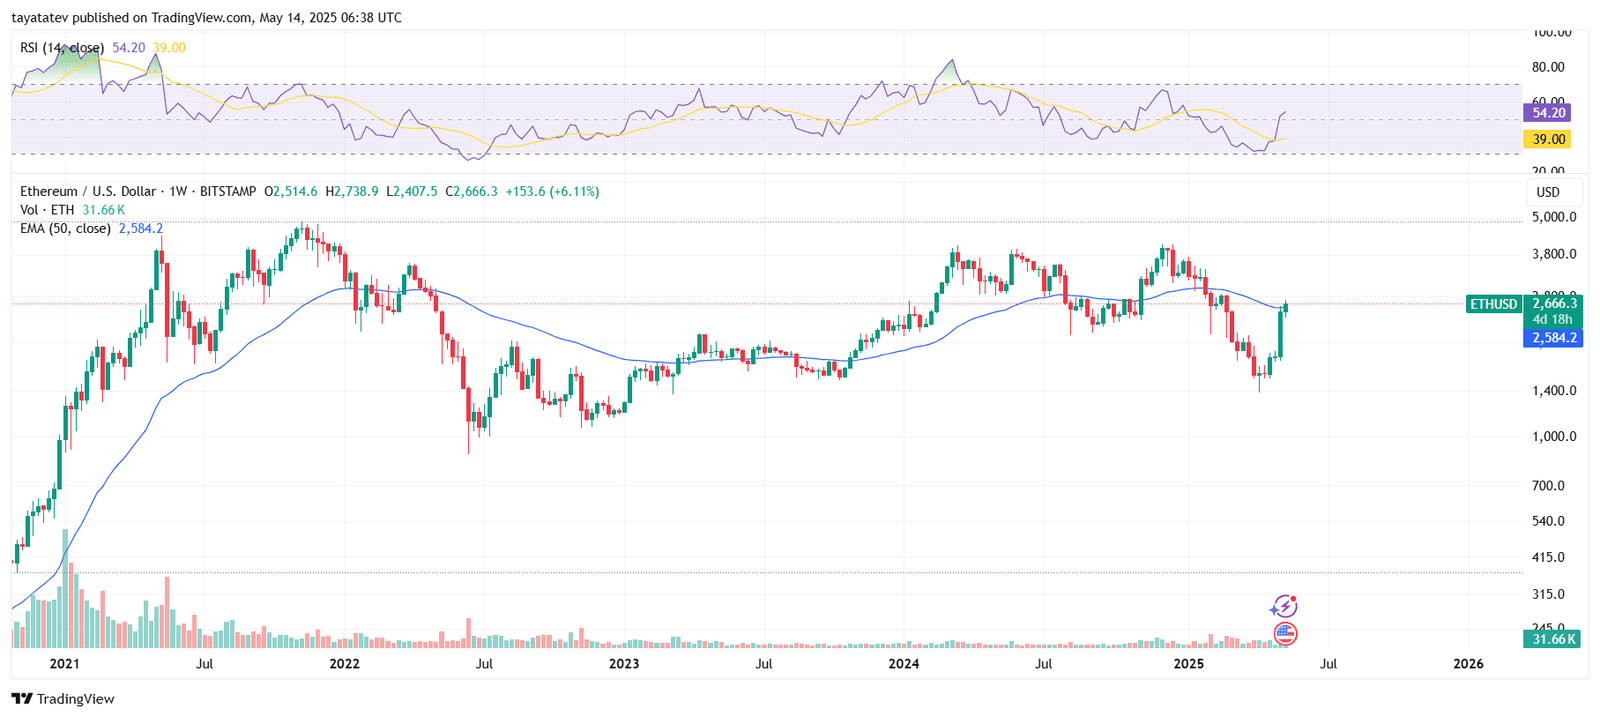
The 50-week EMA is a commonly used trend indicator that reflects the average price over the last 50 weekly candles. Ethereum’s return above this line signals strength in its medium-term momentum. During previous cycles, sustained moves above this EMA have often aligned with broader trend reversals or strong upward phases.
The Relative Strength Index (RSI), calculated on a 14-week basis, now reads 54.20. This places it back above the neutral 50 level, showing that buying momentum has increased. The RSI had fallen to 39 during the March decline but began recovering in April alongside Ethereum’s price rebound.
A reading above 50 indicates a shift toward bullish momentum, though not yet overbought. Traders use the RSI to gauge the strength of price movements, with values between 50 and 70 often seen in steady uptrends.
Trading volume also increased alongside the breakout, with the current weekly volume reading at 31.66K ETH. This confirms strong participation during the rally. Previous surges above the 50-week EMA without volume often failed to hold, but this move appears supported by market activity.
The ETH/USD chart now shows a potential shift in trend structure, with Ethereum recovering from a low near $1,380 earlier this year. The price is now testing the $2,600 zone from above, and holding above the 50-week EMA could reinforce this level as support going forward.
