
A long-time Bitcoin whale has moved aggressively into Ethereum, shifting more than $435 million in assets within hours. Blockchain data shows the wallet sold 4,000 BTC and purchased 96,859 ETH over a 12-hour window. The holding now totals roughly $3.8 billion in Ethereum, according to on-chain trackers.

The move reflects a notable capital rotation, with large investors increasing exposure to Ethereum. Market analysts note that this whale had held Bitcoin for years before diversifying heavily into ETH, highlighting Ethereum’s growing role in institutional portfolios.
Ethereum Gains Traction in Corporate Treasuries
Beyond whale activity, companies are steadily adding Ethereum to their balance sheets. Reports from digital asset firms show that ETH is becoming a strategic reserve asset, similar to Bitcoin’s earlier corporate adoption wave. Drivers include Ethereum’s deflationary supply dynamics, expanding staking yields, and increasing regulatory clarity.
Executives point to Ethereum’s utility in settlement, tokenization, and decentralized finance as reasons for its inclusion. Several corporations now consider ETH not only as a speculative investment but also as a long-term treasury allocation with unrealized gains potential.
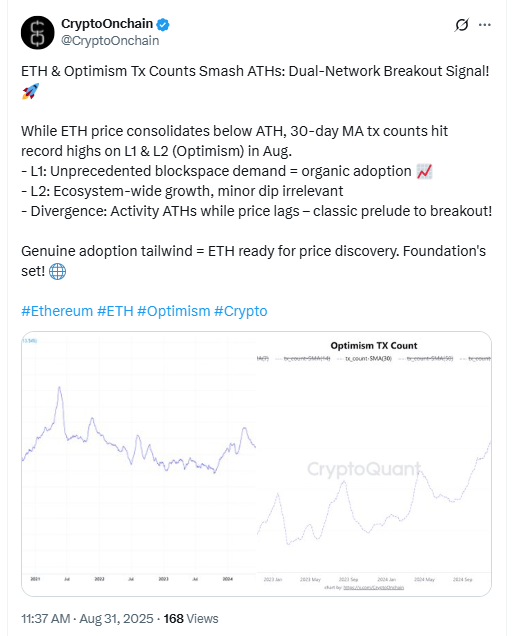
Network Activity Reaches New Peaks
Ethereum’s on-chain activity continues to accelerate. Transaction counts on the mainnet have surged, supported by growing usage of decentralized applications and token deployments. At the same time, the Optimism layer-2 network recorded its own transaction highs, signaling that scaling solutions are absorbing more network demand.
Data indicates developers are deploying contracts on Ethereum at the fastest pace in years. The uptick in smart contract creation suggests new decentralized finance platforms, NFT projects, and enterprise tools are entering the market. Analysts see this expansion as an important step in strengthening Ethereum’s ecosystem resilience.
Contract Boom Reinforces Ecosystem Growth
Recent figures show a contract boom on Ethereum in 2025. This surge follows rising adoption of decentralized exchanges, lending platforms, and tokenized assets. Developers continue to leverage Ethereum’s infrastructure to launch applications that require settlement security at scale.
The growth underscores Ethereum’s dual role as a base layer for decentralized finance and as a reserve asset for both institutions and retail users. With more contracts deployed and higher transaction throughput across both Ethereum and Optimism, the network is reinforcing its position as the backbone of Web3 activity.
Ethereum Forms Bullish Triangle, Targets 53% Upside
The Ethereum ETH/USD chart from September 1, 2025, on the 4-hour timeframe shows a clear bullish triangle pattern. This formation occurs when the price consolidates between rising support and horizontal resistance, usually indicating that buying pressure is building before a potential breakout.
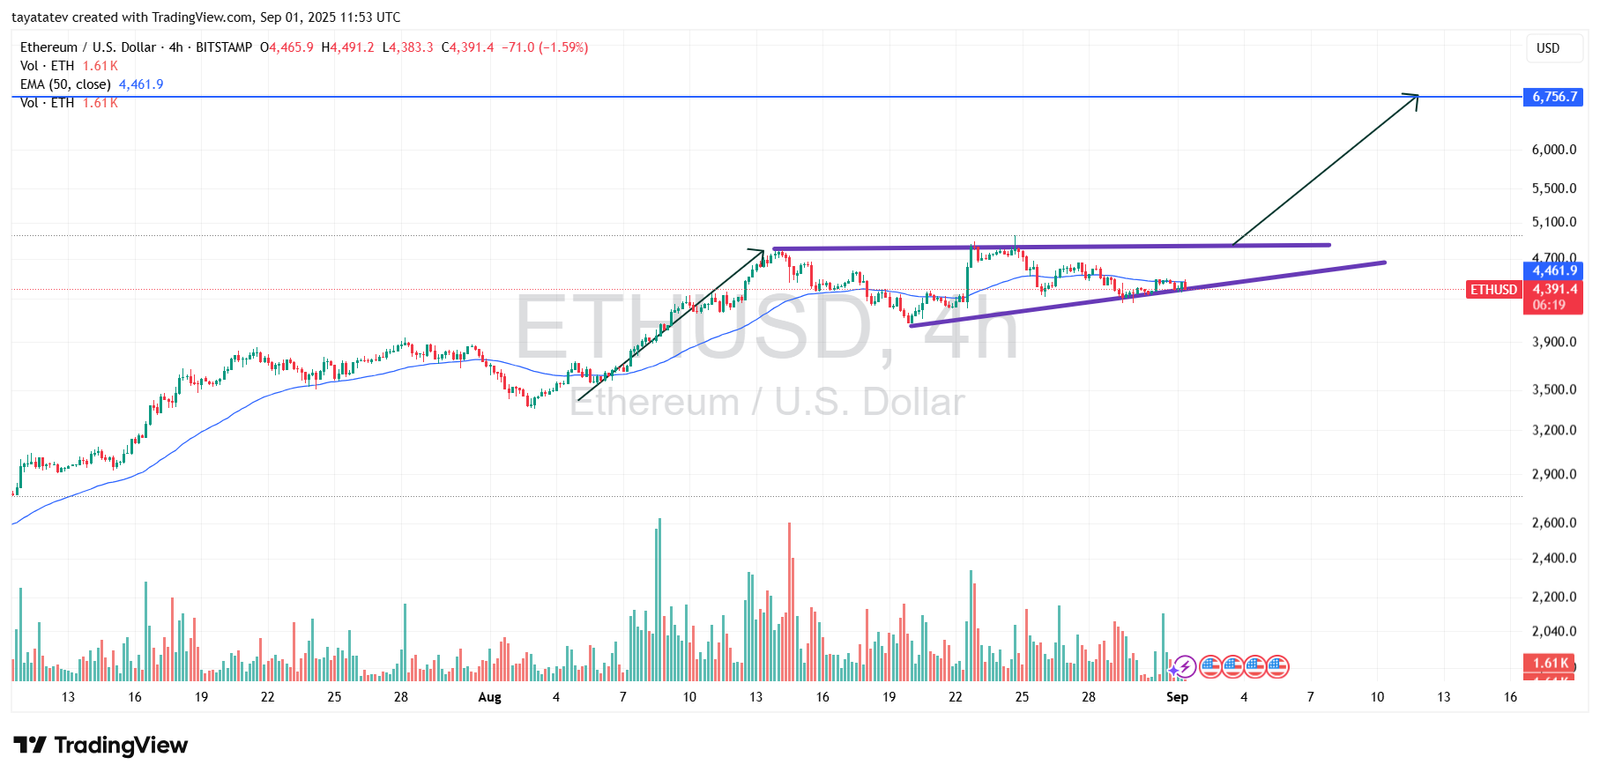
Ethereum is currently trading at $4,391, with the 50-period EMA acting as a dynamic support around $4,461. The triangle has been forming since mid-August, as price action has respected both the ascending trendline and the horizontal resistance near $4,700. This consistent structure signals a tightening range that often resolves with a sharp move once resistance breaks.
If confirmed, the breakout projects a 53% increase from current levels, which places Ethereum’s target around $6,756. This target is calculated by applying the measured move of the triangle’s widest section to the breakout point. The chart also highlights strong volume activity that supports the credibility of this setup, as demand increases during each upward push.
Momentum indicators align with this outlook. Ethereum has shown higher lows throughout August, while sellers have failed to push the price below the rising support line. With Optimism and other layer-2 solutions driving network usage to new highs, the fundamentals provide additional strength to the technical picture.
Ethereum now faces a crucial test. A clean break above the $4,700 resistance zone, backed by volume, would confirm the bullish triangle and open the path toward $6,756, a move that would represent the projected 53% rally from today’s price. Failure to hold the rising support, however, would invalidate the pattern and shift focus back to lower support levels.
Ethereum MACD Signals Early Bullish Momentum
The Ethereum chart from September 1, 2025, shows the MACD (12, 26, close) indicator on the daily timeframe. The MACD line (blue) has recently crossed above the signal line (orange) near the –17 level, while the histogram flipped into positive territory at +4.4. This crossover signals a potential shift from bearish momentum into a new bullish phase.
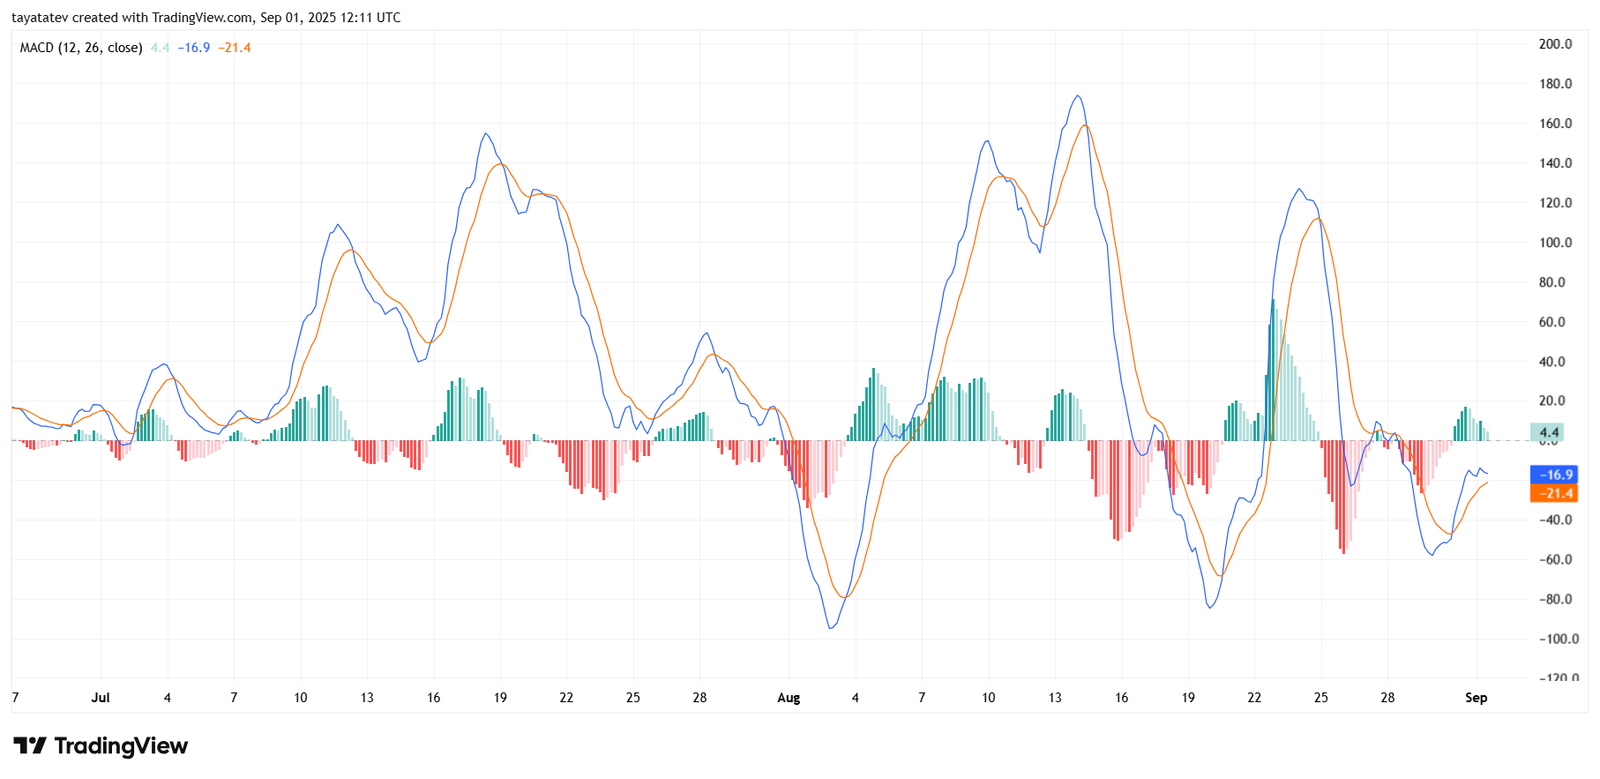
Over the past two months, the MACD has displayed wide swings that reflected Ethereum’s volatile trading. Each time the MACD line crossed above the signal line, upward price moves followed. The most recent example in mid-August coincided with a rally toward $4,700. Now, the early September crossover suggests that buyers are regaining control after a period of consolidation.
The histogram bars turning green confirm the change in momentum. As long as they expand higher, Ethereum should see strengthening bullish pressure. However, the MACD remains below the zero line, meaning the market is still in a recovery phase rather than a full-fledged uptrend. A sustained push above zero would validate the bullish triangle pattern seen on the price chart and support the projected breakout toward $6,756.
Ethereum now sits at a decisive point. If momentum continues to build, the MACD will confirm alignment with the broader bullish technical structure. Conversely, if the crossover weakens and the histogram slips back into red, the breakout could be delayed.
Ethereum RSI Shows Neutral Momentum, Awaits Breakout Confirmation
The Ethereum chart from September 1, 2025, displays the Relative Strength Index (RSI, 14 close) with values at 46.04 and its moving average at 47.17. This level positions Ethereum in the neutral zone, neither overbought nor oversold.
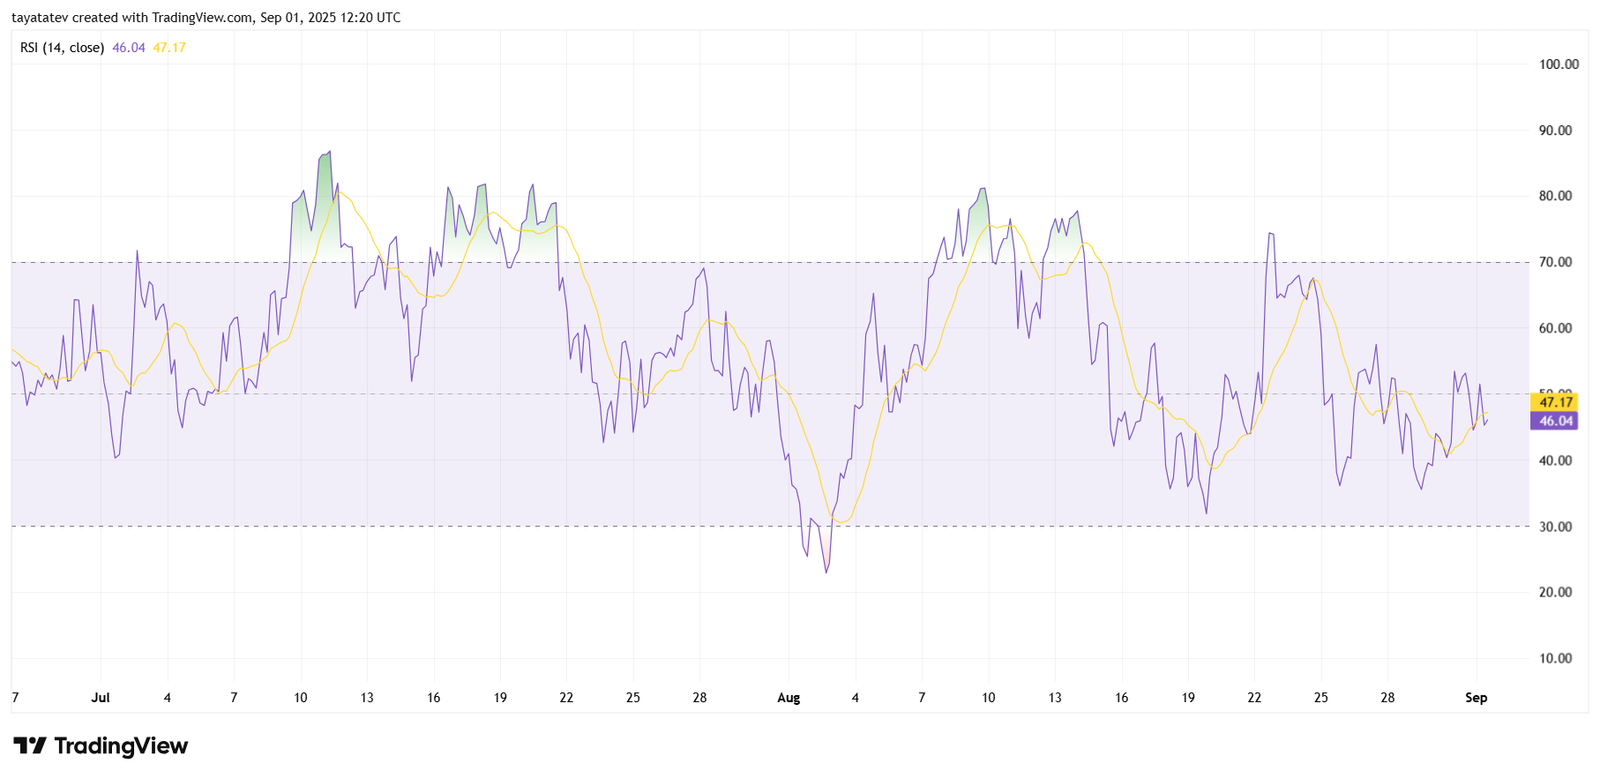
During July and August, the RSI repeatedly tested both extremes. Peaks above 70 signaled temporary overbought conditions, followed by corrections, while dips below 30 marked oversold points that triggered rebounds. The current mid-range reading suggests the market is consolidating after a series of volatile swings.
Price action shows that each RSI dip into oversold territory since July has led to a strong bounce. Conversely, each overbought spike has aligned with local tops. The present range-bound movement between 40 and 50 indicates hesitation, with buyers and sellers balancing ahead of a decisive move.
If Ethereum breaks above resistance at $4,700, RSI will likely push toward 60–70, confirming bullish momentum and aligning with the broader triangle breakout target of $6,756. A drop below the 40 line, however, would point to renewed weakness and risk of a deeper retracement.
Ethereum’s RSI now confirms the standoff visible on price charts: a tightening range that awaits resolution. This indicator suggests momentum is ready to shift, but the trigger will come only with a clear price breakout.
