
On June 16, 2025, crypto analyst MikyEdge published two Ethereum (ETH/USD) weekly charts showing a clear pattern comparison between the 2016–2017 cycle and the ongoing 2024–2025 structure. Both charts illustrate similar price consolidation zones, horizontal resistance levels, and key breakout signals.
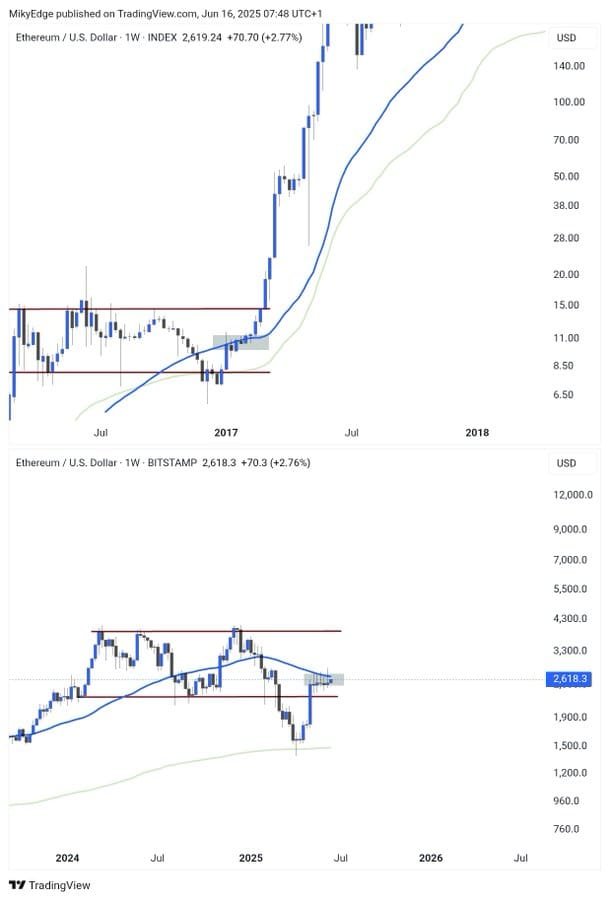
In the first chart (top), Ethereum moved sideways for months before breaking above horizontal resistance near $15 in early 2017. Once ETH cleared this level, it skyrocketed to over $140, confirming a major breakout supported by strong volume and a rising 50-week Exponential Moving Average (EMA).
In the second chart (bottom), ETH shows similar behavior. It ranged between $2,000 and $3,600 throughout 2024. After dipping toward the 200-week EMA around $1,800, it rebounded and is now retesting the $2,600–$2,800 region, closely aligning with the 50-week EMA. The structure mimics the pre-breakout phase from 2017.
Mikybull Compares Current Move to Historic Rally
Mikybull noted: “$ETH SEEMS TO FOLLOW 2017 PLAYBOOK.” He highlighted that Ethereum’s price action is nearly identical to the setup before the explosive 2017 rally. He emphasized that the range consolidation, moving average alignment, and breakout test are all happening again.
According to Mikybull, the current chart setup shows Ethereum “consolidating at major resistance just like in 2017.” He added that the token is “preparing for the next impulsive wave.”
By using the phrase ‘follow the 2017 playbook,’ Mikybull implies that Ethereum could repeat the same historical trajectory. He framed ETH’s current price as being “on the brink of the same kind of breakout.”
This interpretation aligns with the visual evidence: both charts show ETH pressing against horizontal resistance while reclaiming moving average support, a hallmark setup before the 2017 bull run.
If ETH confirms a breakout above the $2,800–$3,000 zone, the chart setup suggests a sharp rally could follow. Ethereum’s historical behavior supports this, as the 2017 move triggered a multi-month surge.
At the time of writing, Ethereum trades at $2,618, up 2.76% on the week, already moving above the descending trendline drawn from the 2024 highs.
Ethereum Whales Accumulate Aggressively as Price Structure Aligns with 2017
On-chain data from Glassnode shows that Ethereum whales—wallets holding between 1,000 and 10,000 ETH—are accumulating again. The chart, titled Ethereum: Whale Net Position Change [Address 1k to 10k ETH], reveals a marked uptick in whale supply net position starting early 2025.
![Ethereum: Whale Net Position Change [Address 1k to 10k ETH]Source: Glassnode](https://coinchapter.com/wp-content/uploads/2025/06/glassnode-studio_ethereum-whale-net-position-change-address-1k-to-10k-eth__7__720.png)
The purple bars represent net position change, where positive values indicate accumulation. These bars have turned decisively positive, signaling sustained buying pressure from large holders. Simultaneously, the red line shows ETH supply held by these wallets rebounding after a multi-year decline, climbing from under 12.5 million ETH to nearly 13.5 million.
This whale behavior coincides with Ethereum’s recovery from sub-$2,000 levels and aligns with the technical structure outlined by Mikybull. The accumulation trend supports the narrative that ETH is “following the 2017 playbook,” as whales historically began positioning just before the explosive 2017 breakout.
‘Whales Are Loading Up Ahead of the Next Move’—that’s the message the data sends. The last time whale addresses showed this level of net accumulation, Ethereum was preparing for a historic multi-month rally. Now, with ETH consolidating near the $2,600 mark and whale support strengthening, on-chain data appears to reinforce the bullish case.
