
On June 6, 2025, the FARTCOIN to Tether (USDT) trading pair on the 4-hour chart formed a falling flag pattern.
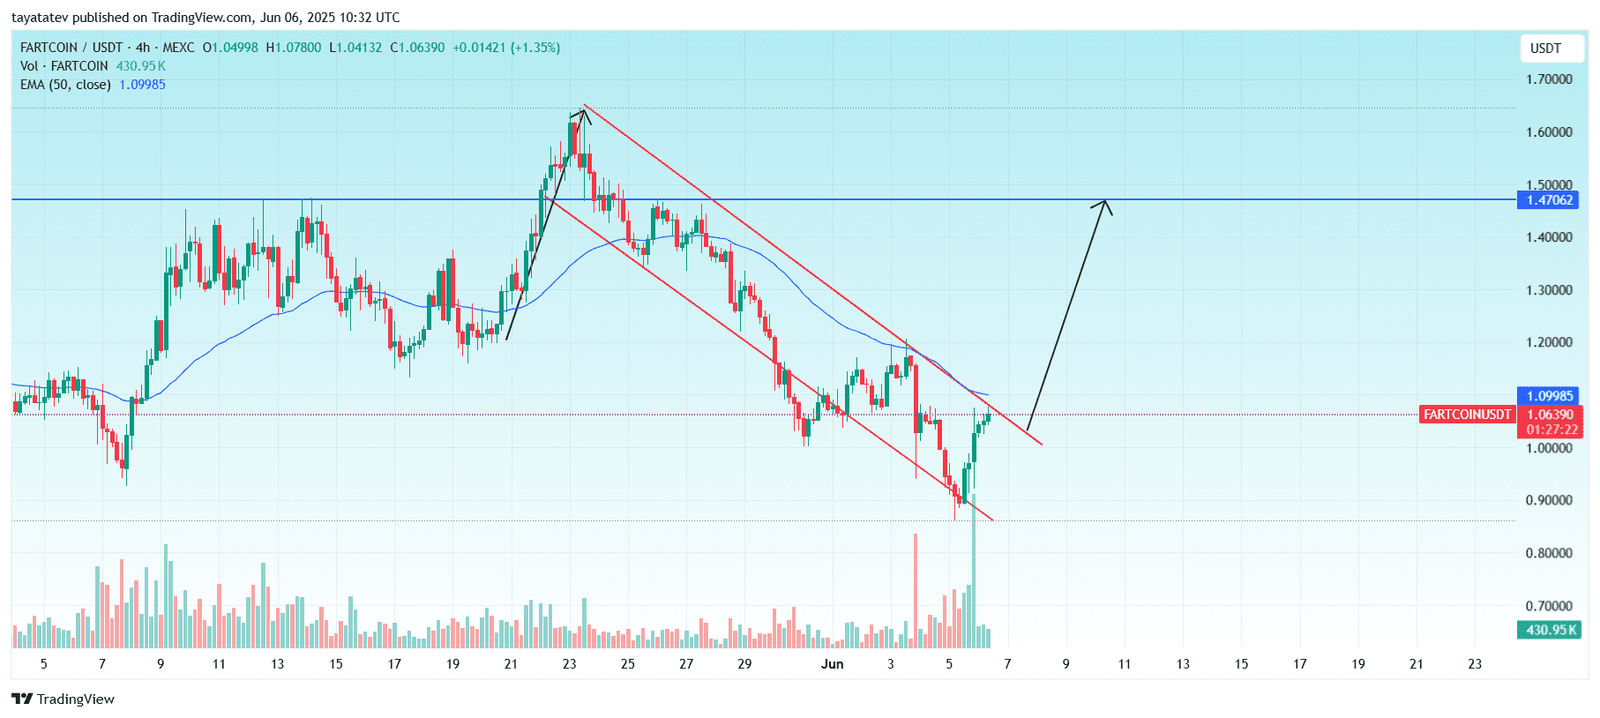
A falling flag pattern appears when the price drops inside a downward-sloping channel after a strong upward move. It typically signals a bullish continuation once the price breaks above the flag’s upper resistance line.
If this breakout confirms, the price can rise 38% from the current level of $1.06390 to the projected target of approximately $1.47062.
The chart shows a clear breakout attempt above the flag’s resistance. At the same time, trading volume has surged, which supports the strength of the move. Volume expansion during breakout often validates the bullish pattern.
In addition, the price is now testing the 50-period Exponential Moving Average (EMA), currently at $1.09985. A decisive close above this dynamic resistance level would strengthen the case for a continued uptrend.
The previous strong rally formed the flagpole. The consolidation phase within parallel descending trendlines shaped the flag. This structure aligns with the classic bullish flag setup.
If bulls maintain pressure and push above the EMA, the price may rally toward the $1.47 target in the coming sessions.
FARTCOIN SMI Indicator Surges, Confirms Bullish Momentum
On June 6, 2025, the FARTCOIN to Tether (USDT) 4-hour chart showed a strong upward move on the Stochastic Momentum Index (SMI), with the blue line (SMI) rising to 52.09 and the orange signal line reaching 31.20.
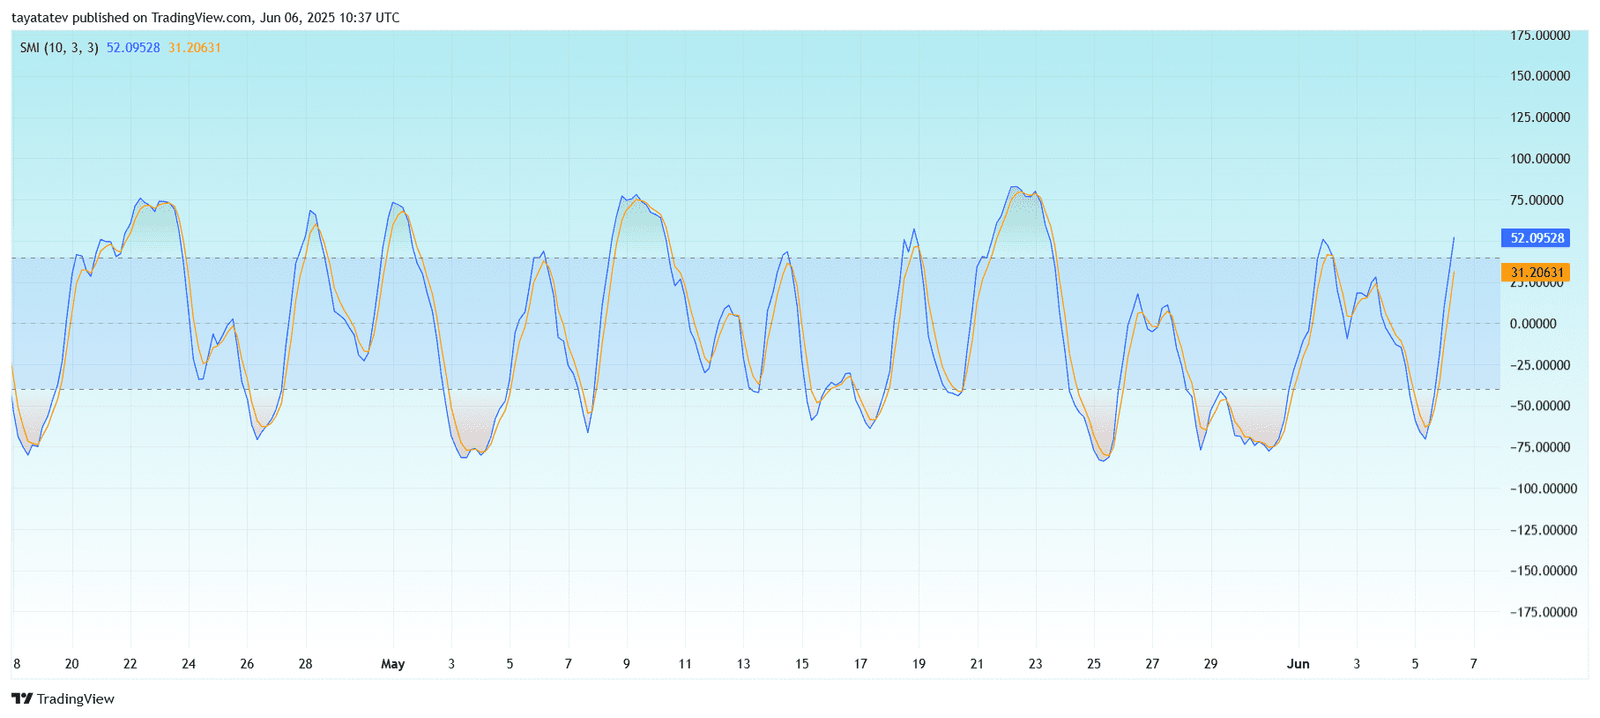
The Stochastic Momentum Index (SMI) is a refined version of the traditional stochastic oscillator. It measures the closing price relative to the midpoint of the recent high-low range and signals overbought or oversold conditions.
In this chart, the SMI line has sharply crossed above the signal line from below the -40 zone. This crossover from a low level typically indicates a bullish reversal. The indicator has also entered the positive territory above the zero line, which reinforces upward momentum.
If the SMI continues rising and stays above the +40 zone, it would confirm sustained buying pressure. The last crossover and upward spike coincide with the breakout from the falling flag pattern seen on the main price chart, aligning technical signals across indicators.
FARTCOIN RSI Breaks Above 50, Signals Growing Strength
On June 6, 2025, the Relative Strength Index (RSI) for the FARTCOIN to Tether (USDT) pair on the 4-hour chart rose to 52.64, moving above its signal line at 39.48.
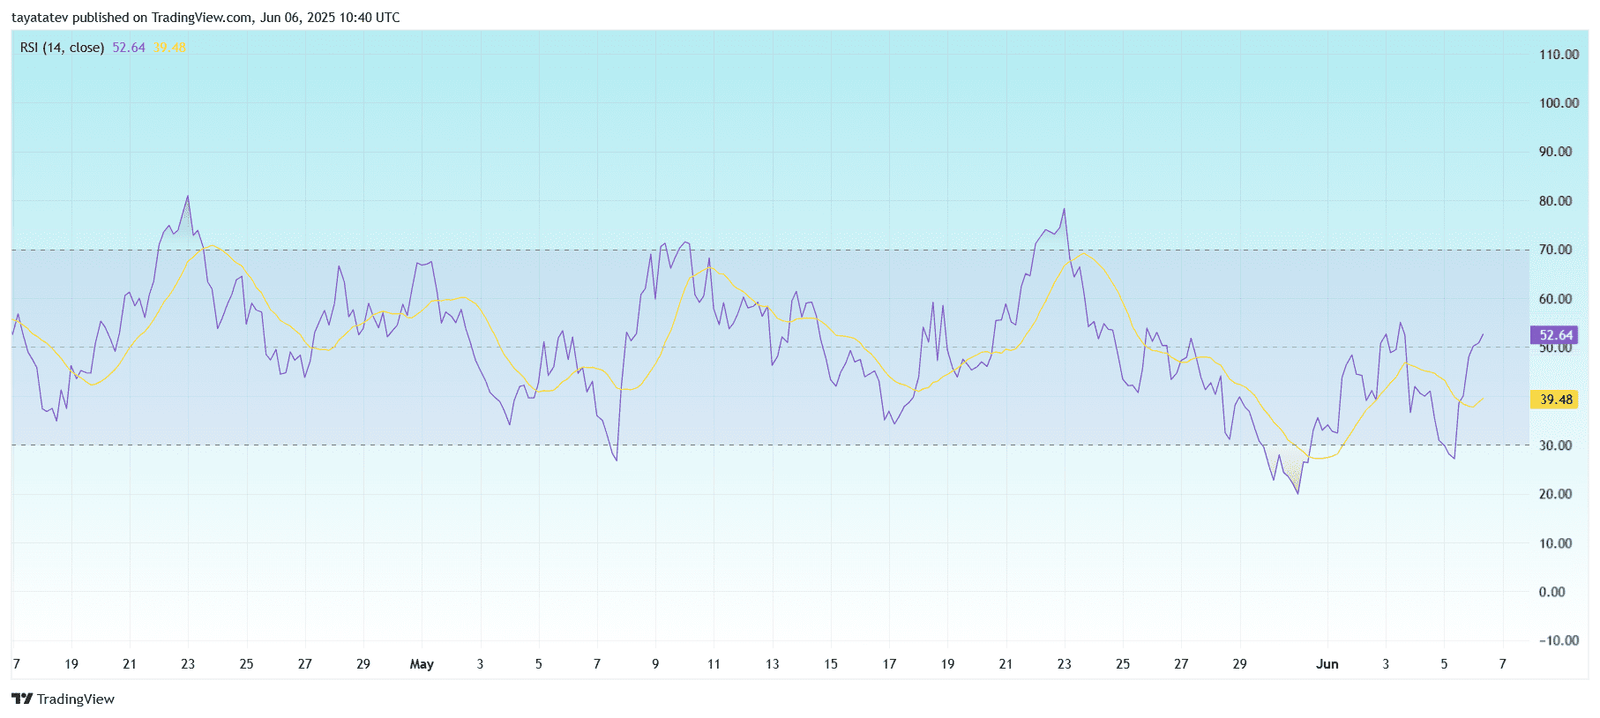
The Relative Strength Index (RSI) measures the speed and change of price movements on a scale from 0 to 100. Values above 50 suggest bullish momentum, while levels below 50 indicate bearish pressure.
This crossover into bullish territory marks the first clean break above the 50 level since the end of May. The RSI line has also crossed above the signal line (yellow), which is often read as a bullish confirmation.
The RSI previously hovered near the oversold area (below 30), then bounced back sharply. This rebound adds confirmation to the breakout seen in the price chart and aligns with the bullish signal from the Stochastic Momentum Index.
If RSI continues to rise and stays above 50, it would support further upward movement in the FARTCOIN price.
MACD Flips Bullish as Histogram Turns Green
On June 6, 2025, the Moving Average Convergence Divergence (MACD) indicator for the FARTCOIN to Tether (USDT) 4-hour chart signaled a bullish crossover. The MACD line (blue) crossed above the signal line (orange), with values at –0.02530 and –0.03865, respectively. The histogram has also turned positive at 0.01336, indicating growing bullish momentum.
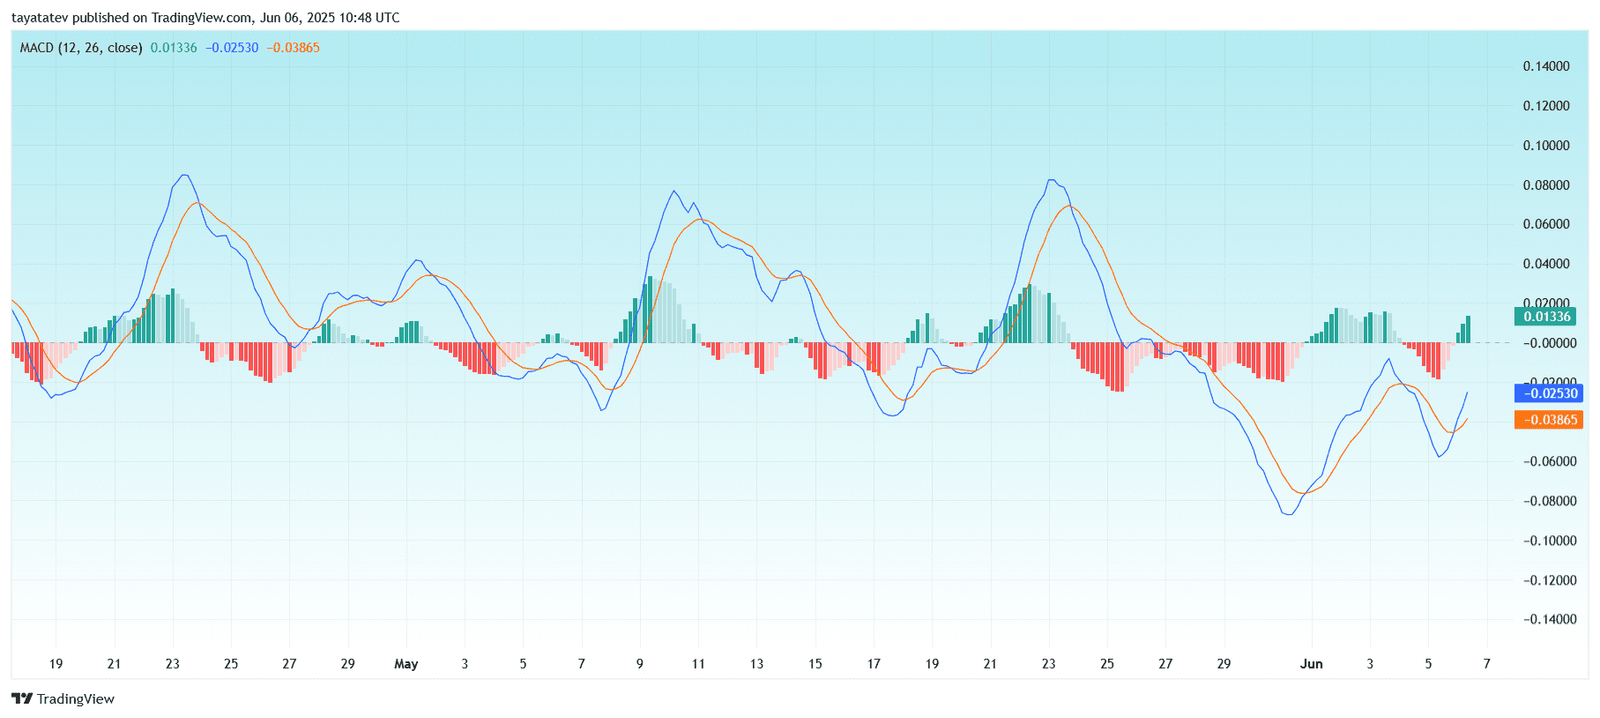
The MACD uses two exponential moving averages — typically 12-period and 26-period — to detect trend changes. A bullish crossover occurs when the MACD line rises above the signal line, suggesting a potential upward price movement.
The histogram turning green reinforces this signal, showing that bullish momentum is accelerating. The MACD is approaching the zero line from below, which, if crossed, would further confirm a trend reversal to the upside.
This MACD breakout aligns with the bullish signals seen in the RSI and SMI indicators, adding more weight to the case for continued upward price action.
FARTCOIN Enters Cloud Resistance Zone, Ichimoku Signals Early Reversal
The FARTCOIN to Tether (USDT) 4-hour chart showed the price climbing back toward the Ichimoku Cloud, testing early resistance from below.

The Ichimoku Cloud, also known as Ichimoku Kinko Hyo, is a comprehensive indicator that shows trend direction, support and resistance levels, and momentum in a single view.
Currently, FARTCOIN trades at $1.07000, just below the 50-period Exponential Moving Average (EMA), now at $1.10009. The cloud’s lower boundary sits near $1.00150, and the upper boundary is around $1.09844. The price has entered this range, signaling the start of a test against resistance.
The chart also shows a recent “Weak Bullish” signal printed below the current candle, followed by a “Strong Bearish” signal from earlier in June. While the cloud is still red, suggesting ongoing bearish structure, price moving into the cloud and approaching the EMA hints at a possible short-term reversal.
Backtesting data on the chart confirms limited historical edge:
21 total trades
Win rate: 28.57%
Median profit/loss per trade: –2.00 USDT
This suggests the setup has historically had limited reliability under current strategy conditions, but the price breakout and momentum should be watched in conjunction with volume and other signals.
