
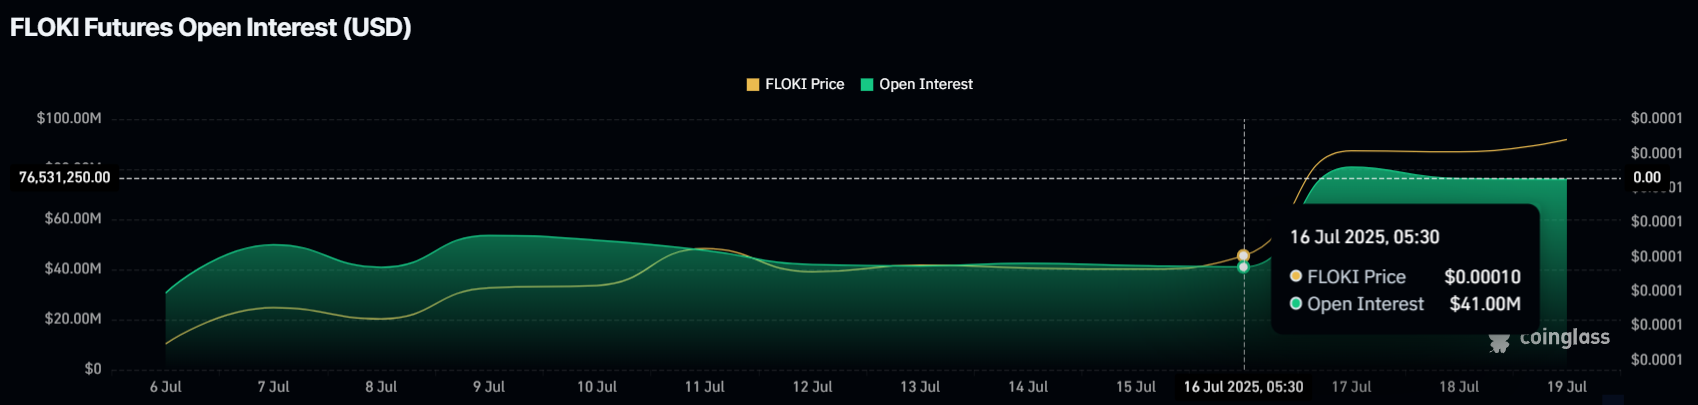
FLOKI’s price went up fast. At the same time, open interest in FLOKI futures rose 87% in just two days — from $40 million to $75 million. This shows that many traders are jumping in because they don’t want to miss out.
The funding rate is also positive, meaning more people are betting that FLOKI will go higher. So, the market looks bullish for now.
However, other data shows a possible risk. The MVRV Ratio — which compares current price to the average price people paid — is now at 32.62%. This means recent buyers are up about 32% on their investment.
In the past, when MVRV was between 19% and 32%, many traders started selling to lock in profits. That often caused FLOKI’s price to drop.
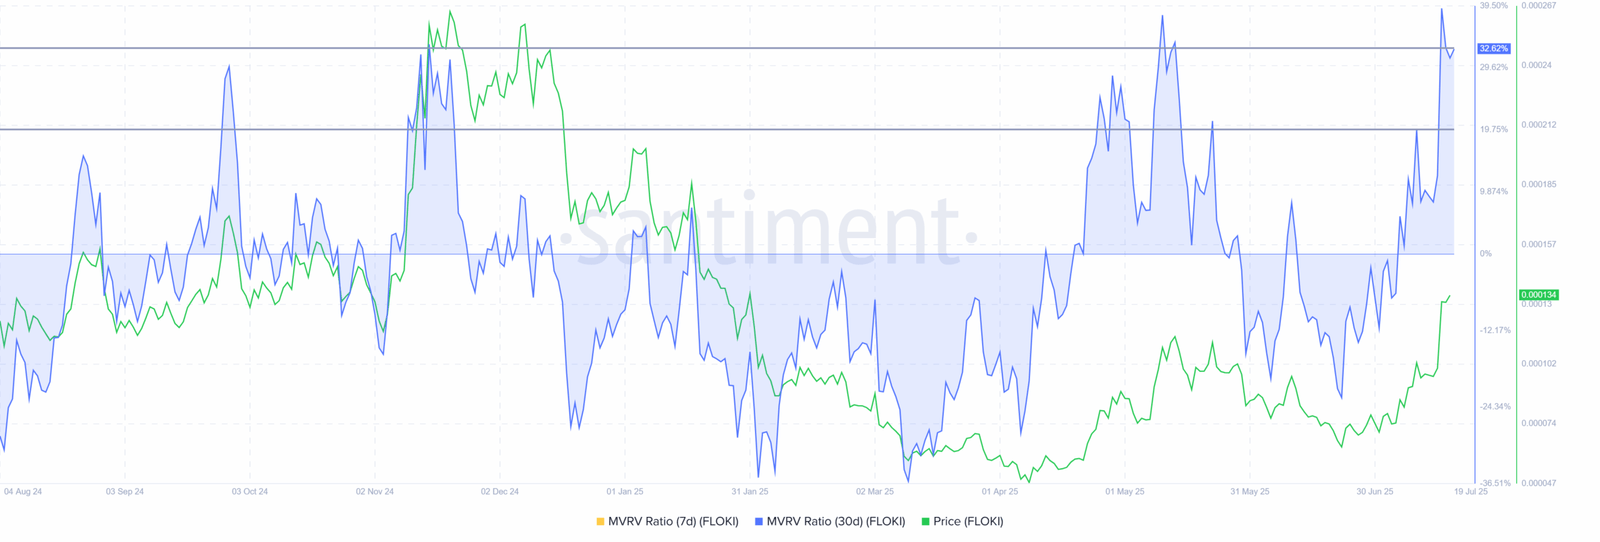
Right now, FLOKI is in that same “danger zone.” Even though the price is rising, the risk of a pullback is high if too many holders decide to sell.
FLOKI Forms Bullish Pattern, Eyes 54 Percent Surge
On July 20, 2025, a new chart on TradingView showed FLOKI/ USDT forming an ascending channel pattern on the 1-hour time frame. An ascending channel pattern happens when the price moves between two upward-sloping lines, showing higher highs and higher lows. It usually signals a possible continuation of an uptrend.
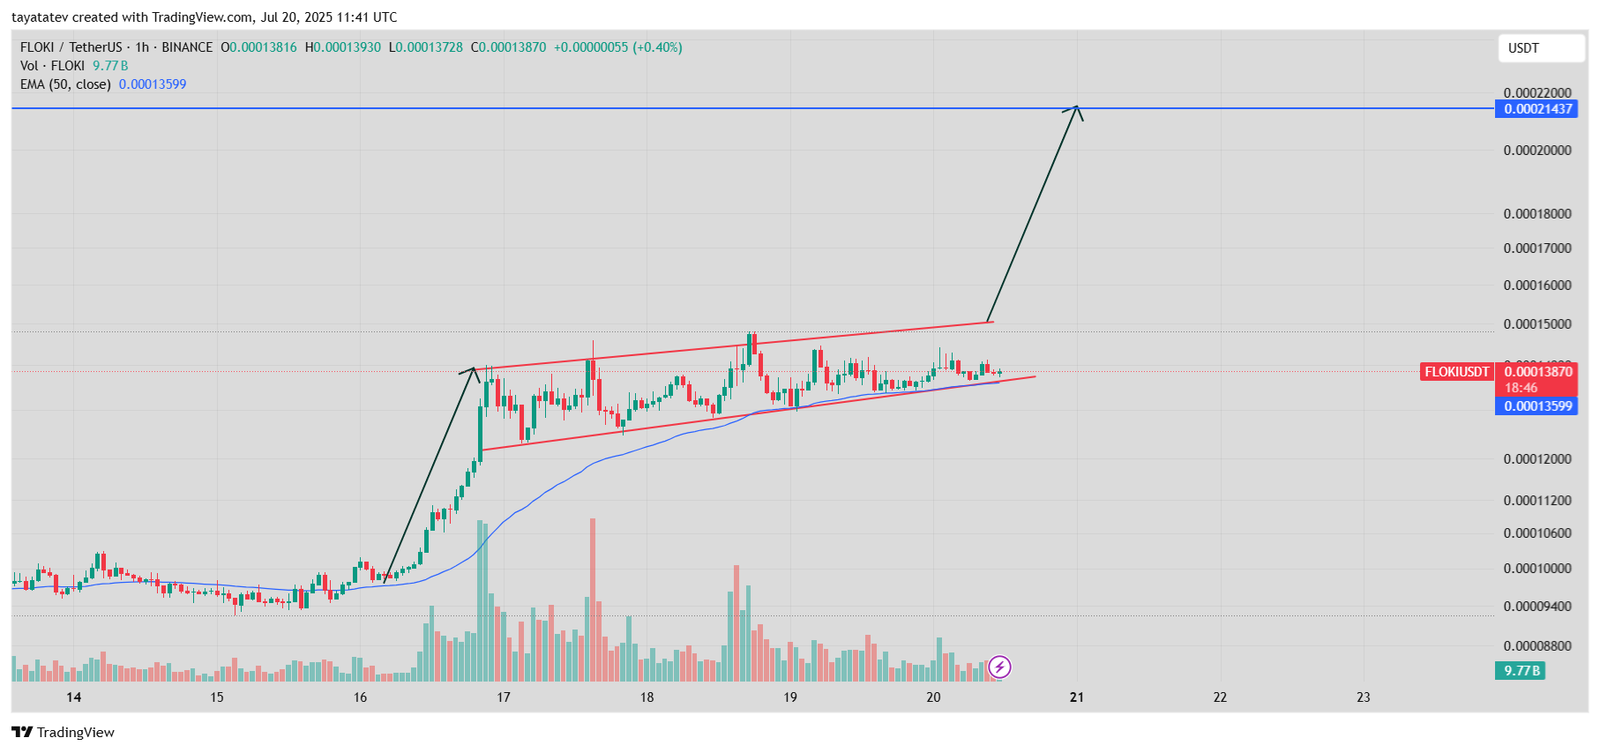
In this case, the price of FLOKI is trading inside this channel, with visible support from the 50-period Exponential Moving Average, or EMA. The chart shows the price at $0.00013870, while the projected breakout target is set at $0.00021437. That marks a 54 percent possible increase if the price breaks above the upper trendline.
The pattern began forming after a strong rally on July 16, when the price surged with high volume. Since then, the price has traded sideways but stayed inside the rising channel. The steady climb in both price and volume signals that traders are still interested. The rising EMA line confirms continued support under the price.
If FLOKI breaks out above the red upper line with strong volume, the next move could be sharp. The breakout target is $0.00021437, as marked on the chart. However, if the price drops below the lower support line, the bullish pattern could fail.
FLOKI RSI Shows Neutral Momentum as Traders Wait
On July 20, 2025, the Relative Strength Index (RSI) for FLOKI on the 1-hour chart showed a reading of 52.47. The RSI moving average line stood slightly higher at 53.54. The Relative Strength Index is a momentum tool that shows if a coin is overbought or oversold. When RSI is above 70, it usually signals overbought conditions. Below 30, it signals oversold.
Currently, FLOKI’s RSI sits near the middle of the scale. This neutral zone means the market is balanced, with no strong buying or selling pressure. After a sharp RSI spike near 90 on July 16, the momentum cooled. Since then, the RSI has stayed around the 50 mark, showing that traders are not pushing strongly in either direction.
The slight drop below the moving average suggests that bullish pressure has slowed, but not fully faded. If the RSI moves back above the 60 level, it could support a price breakout. However, if it dips under 45, that may hint at weakness.
FLOKI MACD Cools Down After Strong Rally
On July 20, 2025, the Moving Average Convergence Divergence (MACD) chart for FLOKI showed signs of fading momentum. The MACD uses two lines — the MACD line and the signal line — to measure trend strength and direction. It also includes a histogram that shows the gap between the two
zFLOKI MACD Signals Slowing Momentum
Source: TradingView
lines. When the MACD line is above the signal line, it often signals bullish momentum. When it drops below, it may show weakness.
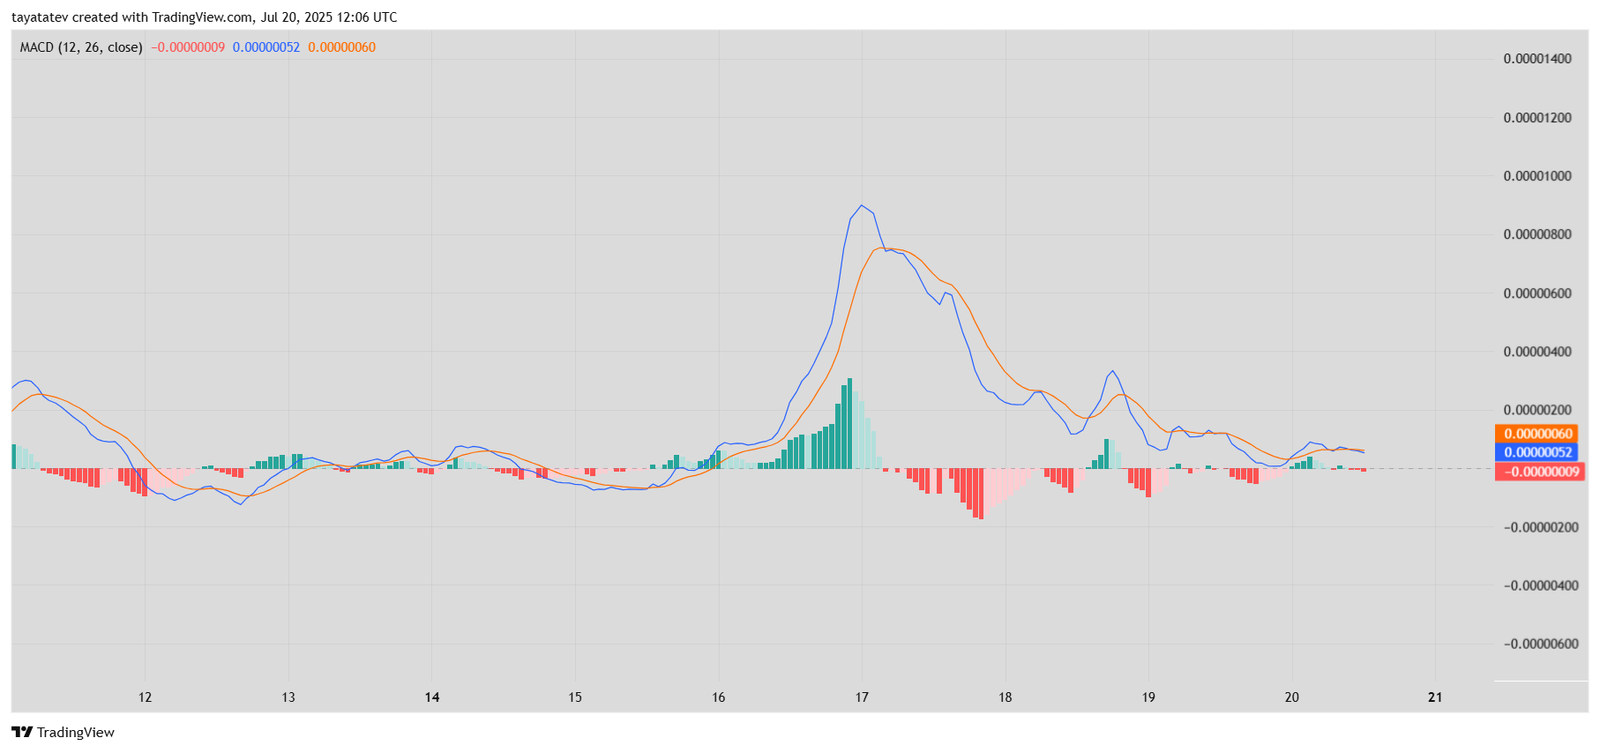
Right now, the MACD line is at 0.00000052, while the signal line is at 0.00000060. The histogram value is slightly negative at -0.00000009. That means the MACD line just crossed below the signal line, pointing to a bearish shift.
After a strong upward move on July 16, both MACD and histogram bars spiked sharply. Since then, the histogram bars have turned red and shrunk, showing that buyers are losing strength.
The MACD is still near zero, so there’s no strong downtrend yet. But this crossover may mean that the recent rally is slowing. If the MACD continues down, FLOKI could enter a short-term cooling phase.
FLOKI Directional Index Flashes Weak Trend Strength
On July 20, 2025, the Directional Movement Index (DMI) for FLOKI showed mixed signals on the 1-hour chart. The DMI includes three lines: the Positive Directional Indicator (+DI), the Negative Directional Indicator (–DI), and the Average Directional Index (ADX). This indicator helps traders measure the strength and direction of a trend.
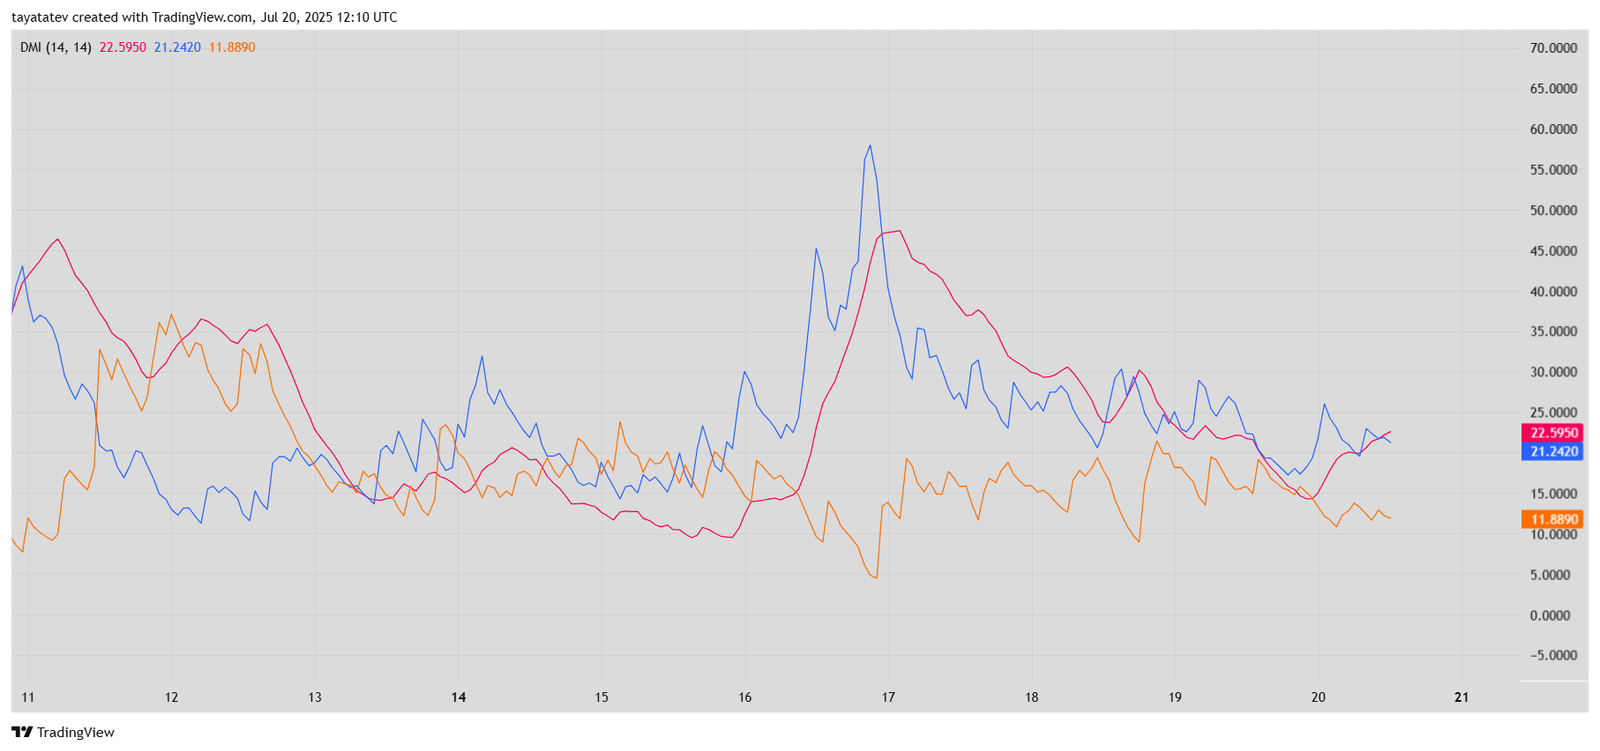
The +DI (blue) is at 21.24, while the –DI (orange) sits lower at 11.88. The ADX (pink), which tracks trend strength, is at 22.59. Since the blue line is above the orange one, buyers still have control. But the low ADX shows the trend is not strong.
Earlier, on July 16, the ADX spiked past 60, showing strong trend momentum. Since then, the ADX has dropped steadily, meaning that the strong push from bulls has faded. At the same time, the +DI and –DI lines are getting closer, which could lead to sideways price action if no clear winner emerges.
For now, FLOKI holds a slight bullish bias, but the weakening ADX shows that the trend is losing power.
