
The FUNUSDT weekly chart, created on July 4, 2025, shows a clear bearish rising wedge pattern.
A bearish rising wedge is a chart pattern where the price moves upward between two converging trendlines. Even though the price climbs, the pattern often signals a future drop when the lower trendline breaks.
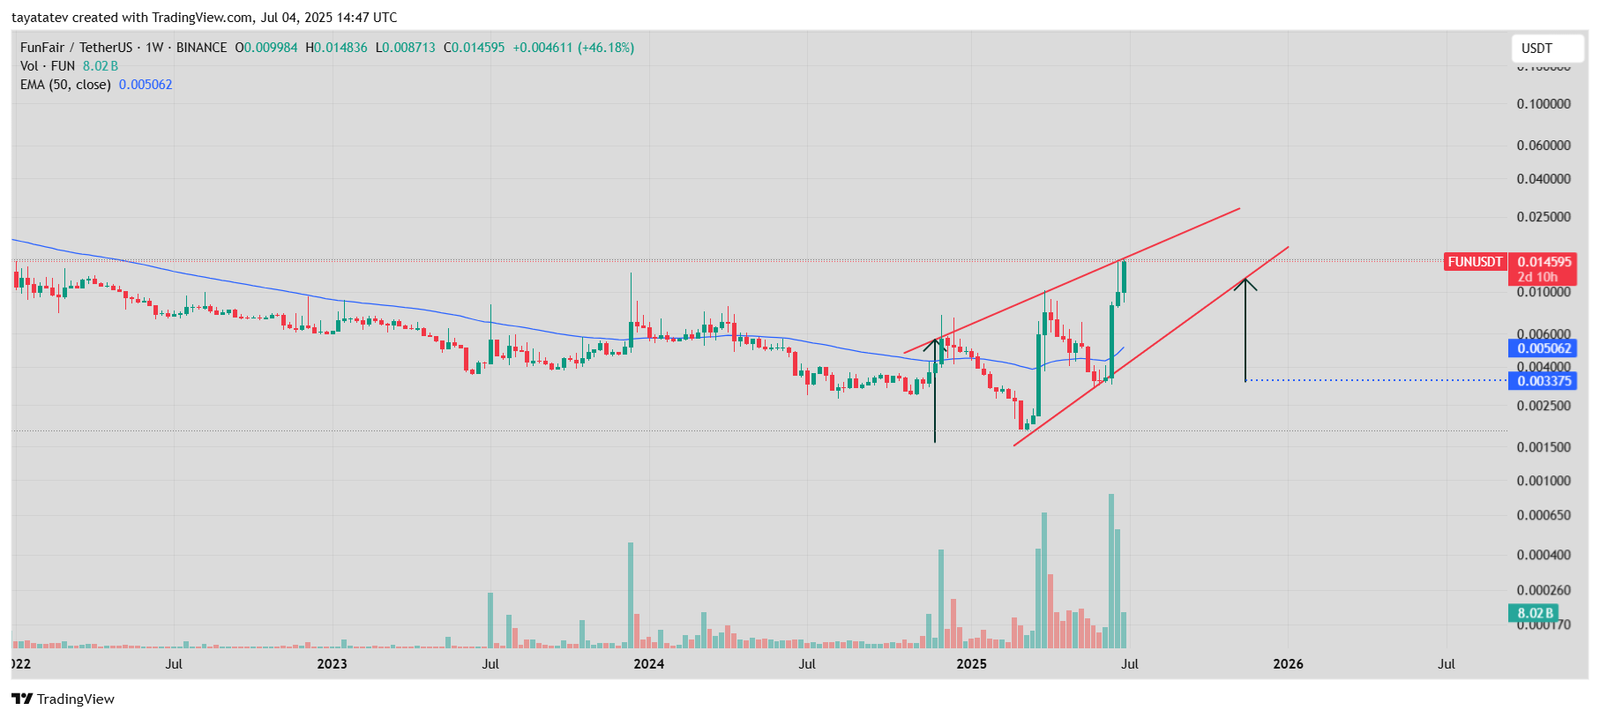
The wedge began forming in mid-March 2025, with higher highs and higher lows leading into the current price of $0.0146.
If this pattern confirms with a breakdown, the price could drop around 341% from the current level to the target zone near $0.003375.
The exponential moving average (EMA), based on 50 weeks, is positioned at $0.005062, acting as a mid-level support. However, if the wedge breaks downward, this support might not hold.
The measured move, shown by the vertical black arrow, supports the idea that the fall could reach the $0.0033–0.0040 area, which aligns with previous price consolidation zones.
Volume has increased during the wedge formation, which strengthens the case that a breakdown could trigger sharp movement.
FUNToken RSI Hits Overbought Zone, Signals Possible Drop
The weekly RSI (Relative Strength Index) for FUNToken reached 78.86 on July 4, 2025. This number is above 70, which means the token is in the overbought zone. When RSI moves above 70, it usually shows that the price has gone up too fast and may drop soon.
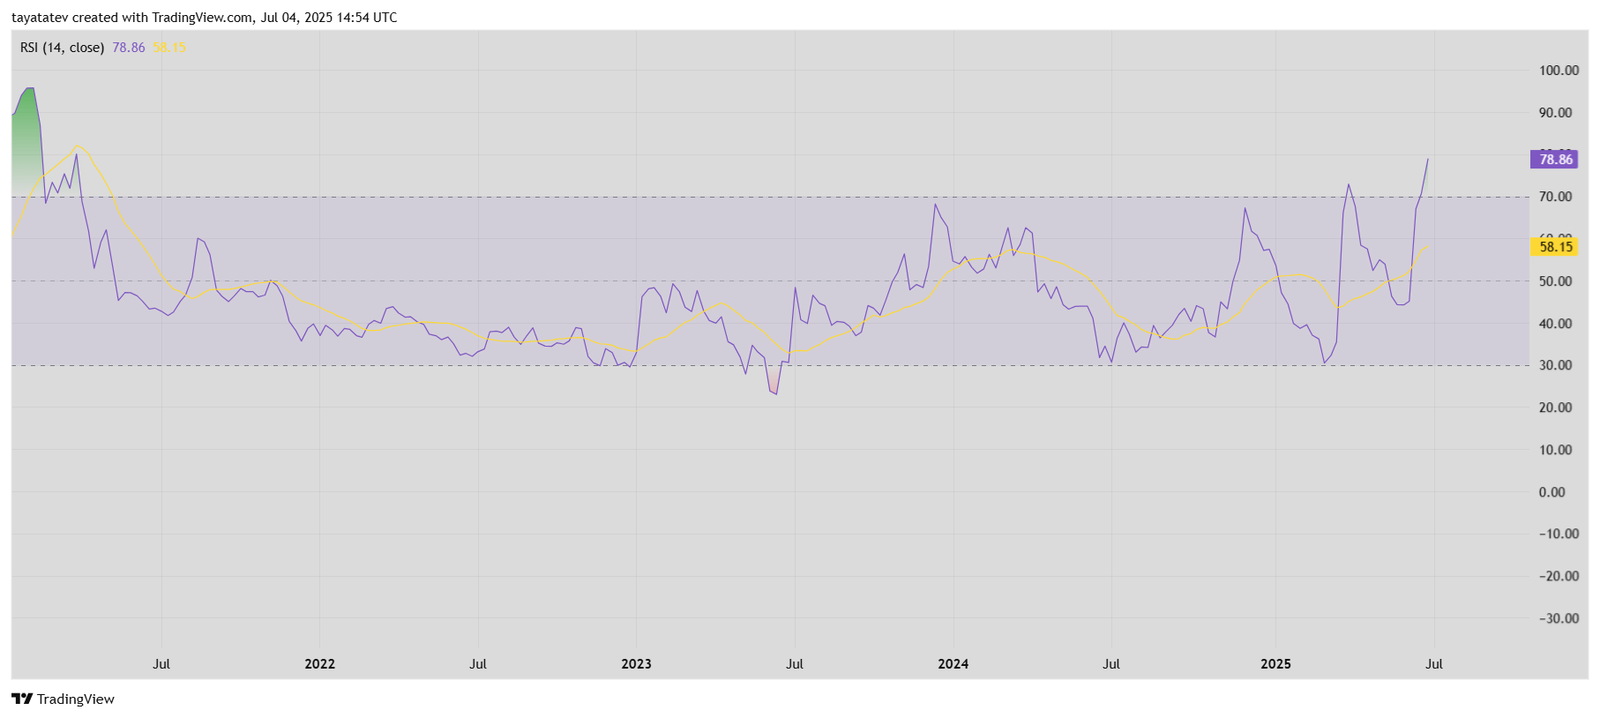
The RSI line is also far above its yellow average line at 58.15. This shows strong buying activity, but the gap between the two lines may not last long. If buyers slow down, the RSI can start falling, which often leads to a price correction.
This signal matches the earlier chart showing a bearish rising wedge, a pattern that usually leads to a drop. If the RSI turns down in the coming days, it would confirm that sellers are coming back
