
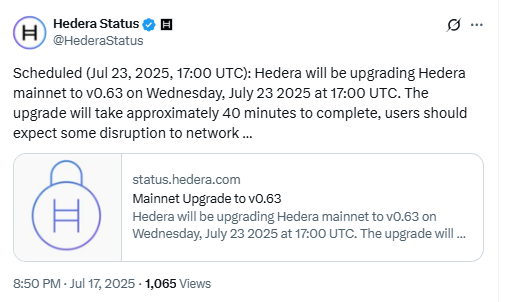
Hedera will upgrade its mainnet to version 0.63 on July 23, 2025, at 17:00 UTC, according to the project’s official schedule. The network expects the update to take approximately 40 minutes. During this period, transaction processing may temporarily slow across the entire Hedera network.
No Change to HBAR Tokenomics or Smart Contracts
The update will focus on network performance and system operations. It will not affect HBAR tokenomics or the way smart contracts are executed on the platform.
The version 0.63 release will introduce three core updates:
Support for non-zero shard and realm IDs in system-level commands.
Fee configuration throttling, which applies rate-limiting to admin-level changes.
MerkleDB tuning, aimed at boosting node storage performance and lowering processing costs.
These updates are designed to enhance stability, control, and efficiency across the network.
The upgrade will also allow Hedera CLI tools like yahcli to function across custom network partitions, giving developers and node operators more flexibility during deployment.
Additionally, Hedera says the upgrade will improve ledger syncing time and increase throughput, helping the network support larger-scale enterprise use cases.
HBAR Breaks Out of Bullish Triangle, Up 52% With Room for More
On July 22, 2025, the HBAR/USDT chart shows a clear descending bullish triangle pattern that was created over several months. This pattern forms when the price makes lower highs but holds a strong horizontal support level. It signals that sellers are weakening, and buyers may soon take control.
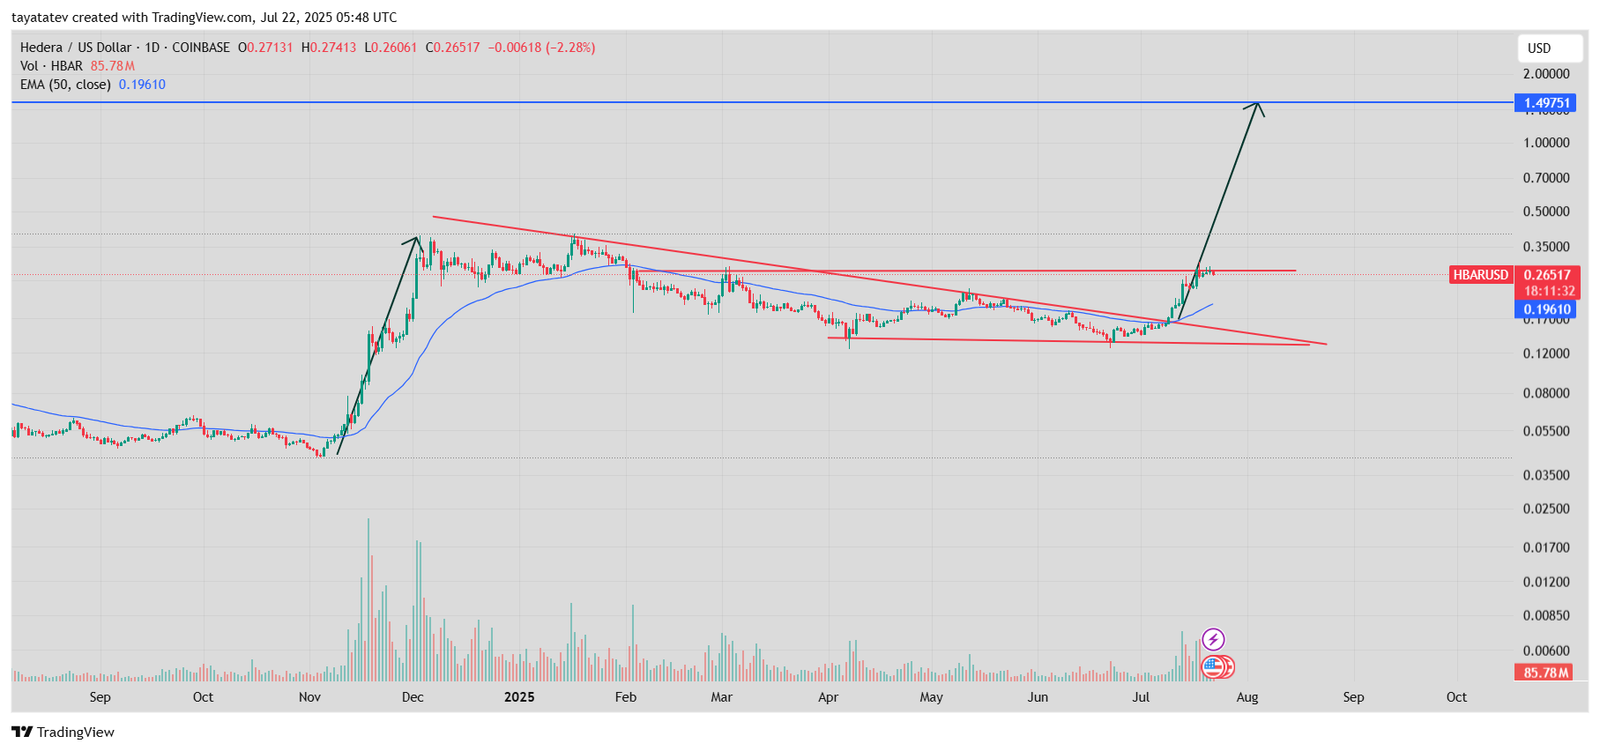
After breaking above the triangle’s top, HBAR jumped 52% from the breakout point. The current price is $0.2651, based on Coinbase data. From this level, a full breakout projection suggests a potential rise of up to 498%, which would target around $1.49—marked by the thick blue resistance line above.
Right now, the price is hovering near a resistance zone, where it previously failed to move higher. This zone is acting as a short-term barrier. If HBAR breaks this level with strong volume, the rally could continue toward the projected target.
The 50-day EMA, now at $0.1961, is trending upward and far below the current price, supporting the bullish structure. Meanwhile, the increase in trading volume confirms growing interest from buyers.
HBAR is consolidating just below resistance. If it holds above the breakout zone, bulls may push it higher in the coming days.
HBAR RSI Enters Overbought Zone With Values Above 70
Meanwhile, the HBAR daily Relative Strength Index (RSI) chart shows a reading of 73.48, while its RSI-based moving average stands at 75.51. Both values place HBAR in the overbought zone, which typically starts above the 70 level.
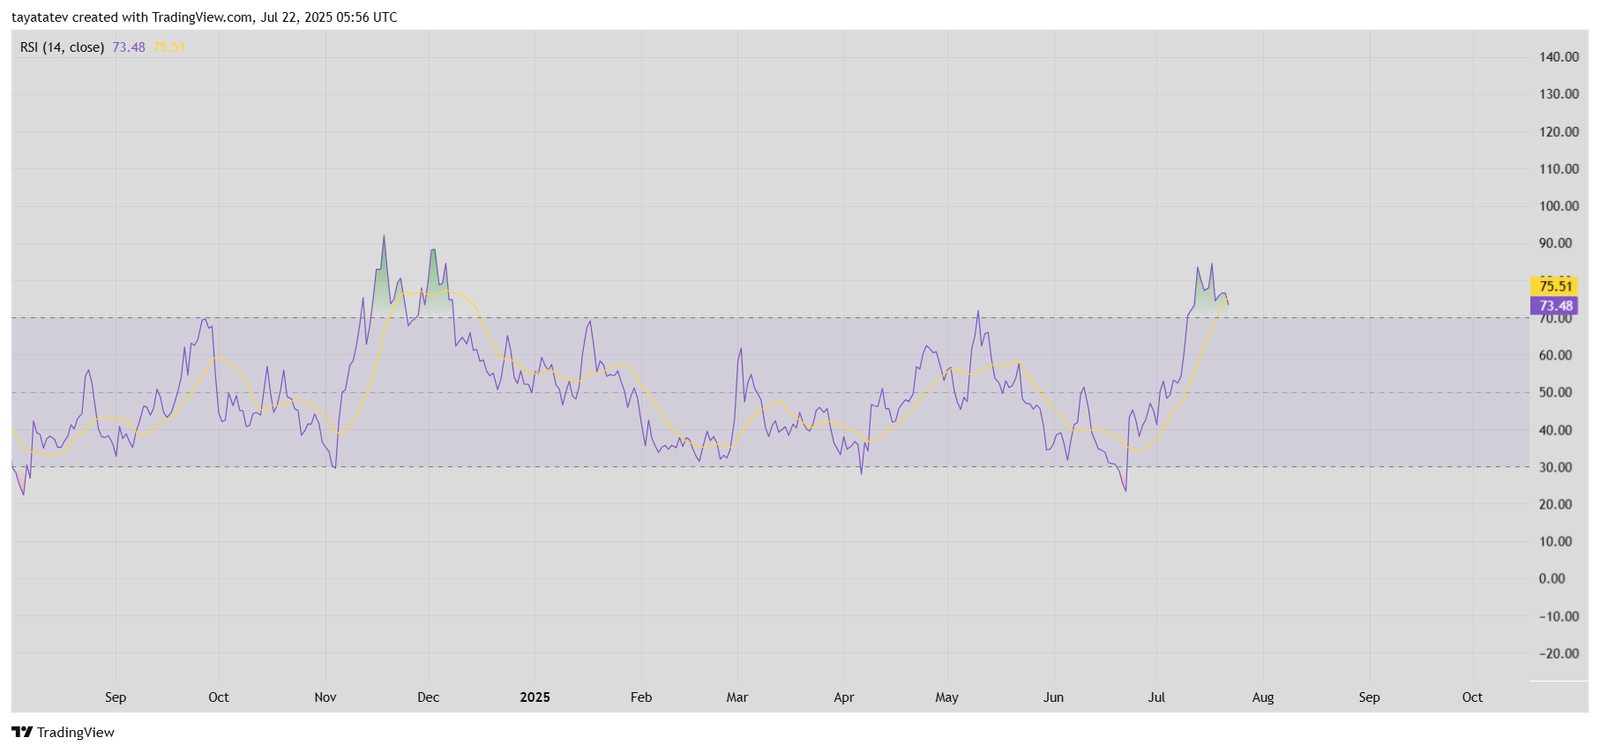
The RSI indicator measures how fast and how strongly the price moves. Values above 70 suggest strong buying momentum, but they also indicate that the asset may be temporarily overextended. In past cycles, similar RSI spikes for HBAR have often led to short pauses or corrections before further moves.
Looking back, the RSI also crossed 70 in late November 2024 and again in July 2025. Both times, HBAR saw a pullback shortly after. However, the price eventually continued to trend higher once the RSI cooled off.
The current RSI curve shows a slight downturn, suggesting momentum is slowing, even though it’s still above the overbought threshold. Traders watching HBAR now will likely monitor whether this dip extends below 70, which would hint at consolidation or minor correction in the short term.
Still, the broader RSI trend since early July shows strong bullish momentum. The RSI remains well above the 50 midline, indicating that upward pressure is still dominant despite the short-term cooling.
HBAR MACD Shows Strong Bullish Momentum With Fresh Crossover
On July 22, 2025, the daily MACD (Moving Average Convergence Divergence) for HBAR shows a clear bullish crossover. The MACD line (0.02946) is now above the signal line (0.02367). The histogram is also positive at 0.00579, indicating growing momentum in the upward direction.
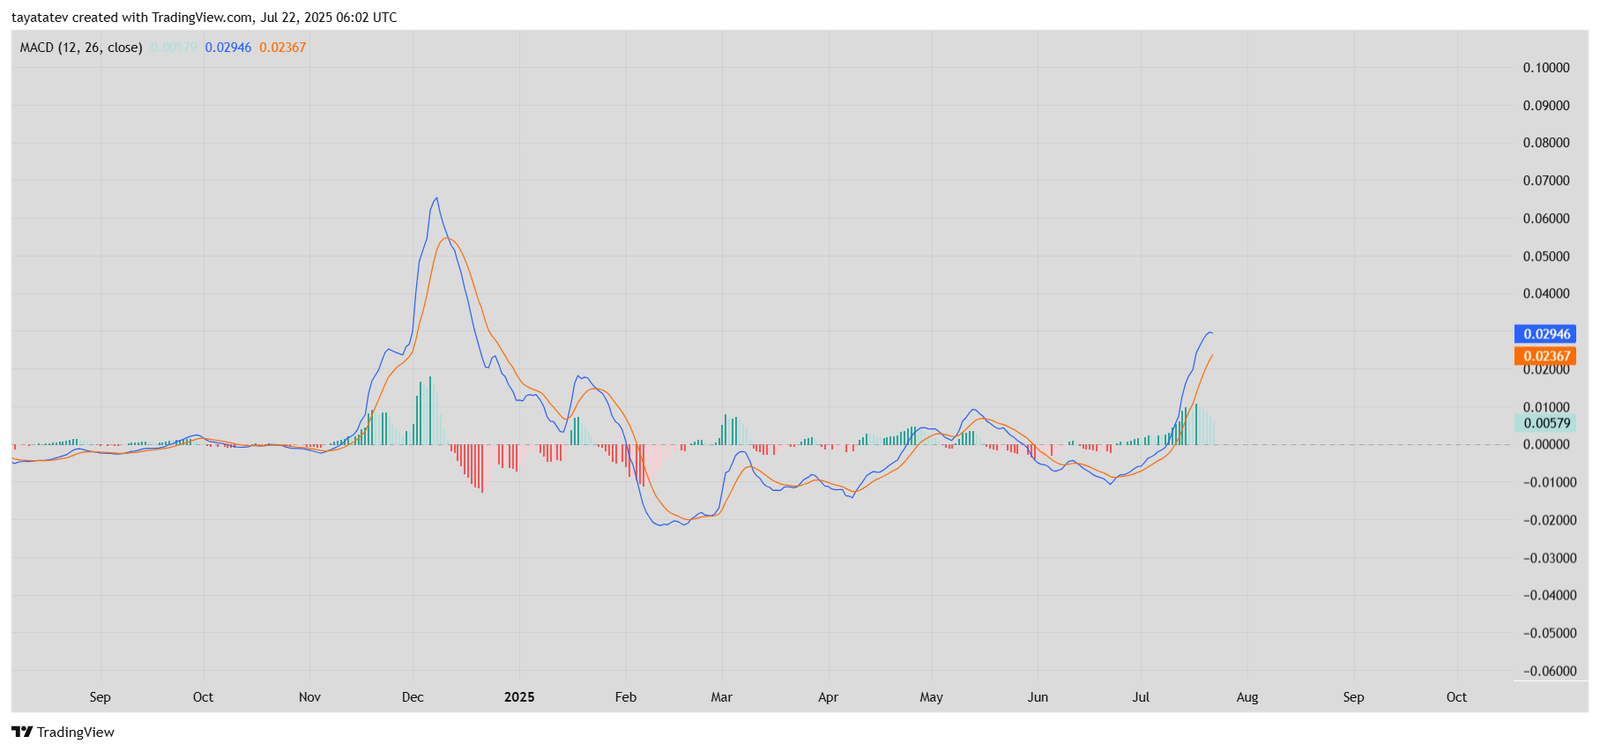
This crossover occurred in early July, right before HBAR’s recent price breakout. Since then, both the MACD line and histogram bars have continued to rise, showing increased buying pressure.
Looking back, the last strong MACD crossover with similar slope and volume happened in November 2024. That move led to a major rally in HBAR. The current setup closely resembles that earlier phase, with similar histogram growth and MACD angle.
As of now, the histogram bars are widening, which means bullish strength is still building. The MACD line is curving upward, while the signal line lags behind, confirming the trend.
Unless a sharp drop reverses this setup, the MACD structure supports continued upside for HBAR. However, the increasing distance between MACD and signal lines suggests that a slowdown could follow once momentum peaks.
For now, the chart confirms that HBAR remains in a bullish momentum phase, backed by strong trend acceleration on the daily MACD.
HBAR DMI Confirms Strong Uptrend With Rising ADX
The Directional Movement Index (DMI) for HBAR shows a strong bullish trend. The +DI (blue) is at 39.67, while the –DI (orange) has dropped to 6.48. The ADX (pink), which measures trend strength, stands at 48.13, indicating high momentum behind the move.
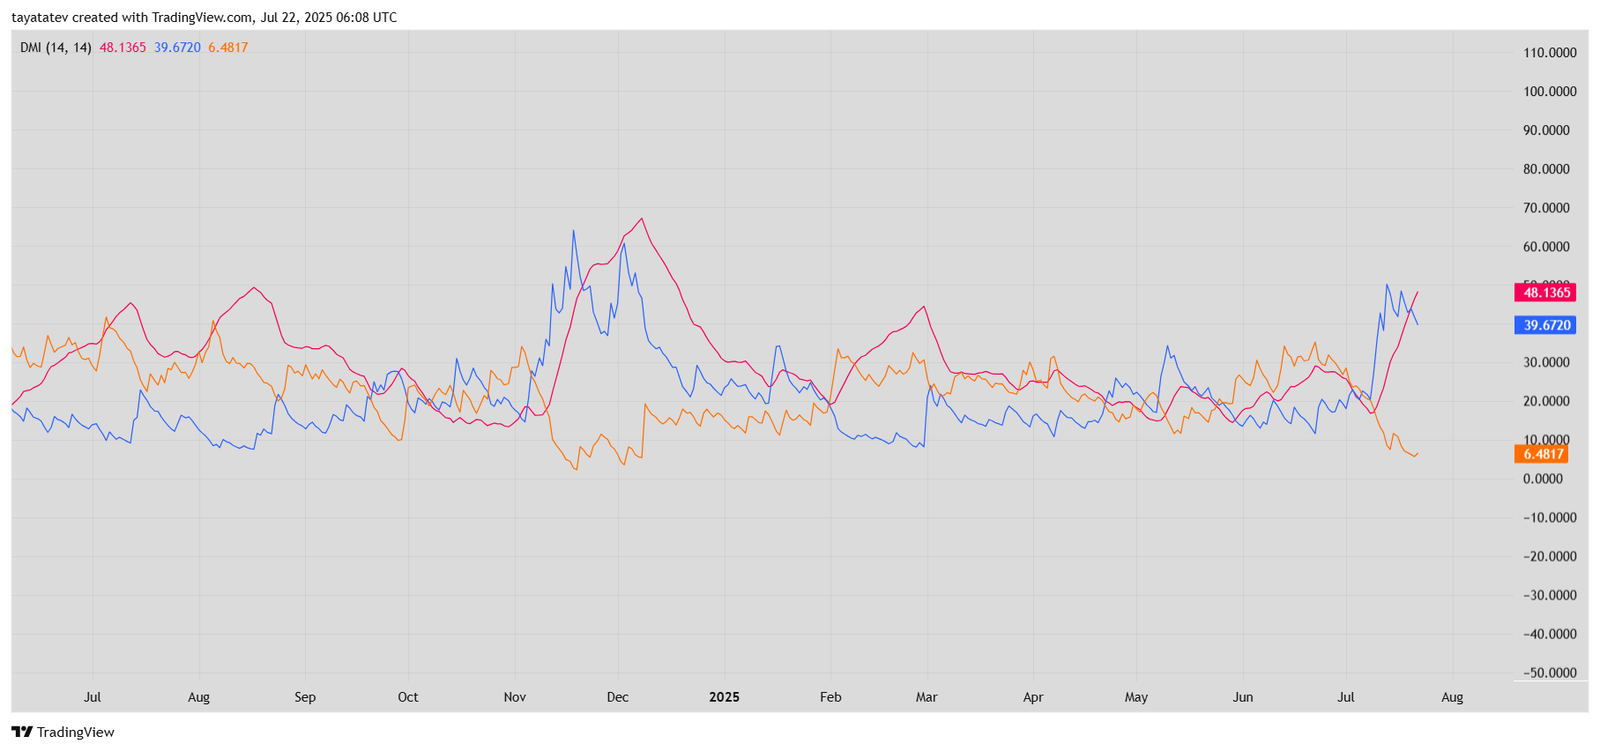
The wide gap between +DI and –DI confirms strong buying pressure. This separation shows that the current upward trend has dominance and is unlikely to reverse immediately. The +DI line remains elevated, while the –DI continues to decline, confirming that sellers are not in control.
Meanwhile, the ADX line has surged above 40 and continues to rise. This value is significant. When ADX crosses 25, it signals a strengthening trend. Above 40, it suggests that the trend is well-established and backed by strong market activity.
Looking at past chart sections, similar ADX values were seen in late November and early December 2024, when HBAR made a major move. The current chart shows a similar setup with a steep ADX curve and a wide gap between the directional indicators.
As long as ADX continues to climb and the +DI stays above the –DI, the current uptrend remains technically supported.
