On May 28, 2025, the HBAR/USD daily chart showed a bearish flag pattern. A bearish flag forms after a sharp downward move, followed by a short period of consolidation between two parallel upward-sloping lines. This setup typically signals the continuation of the prior downtrend.
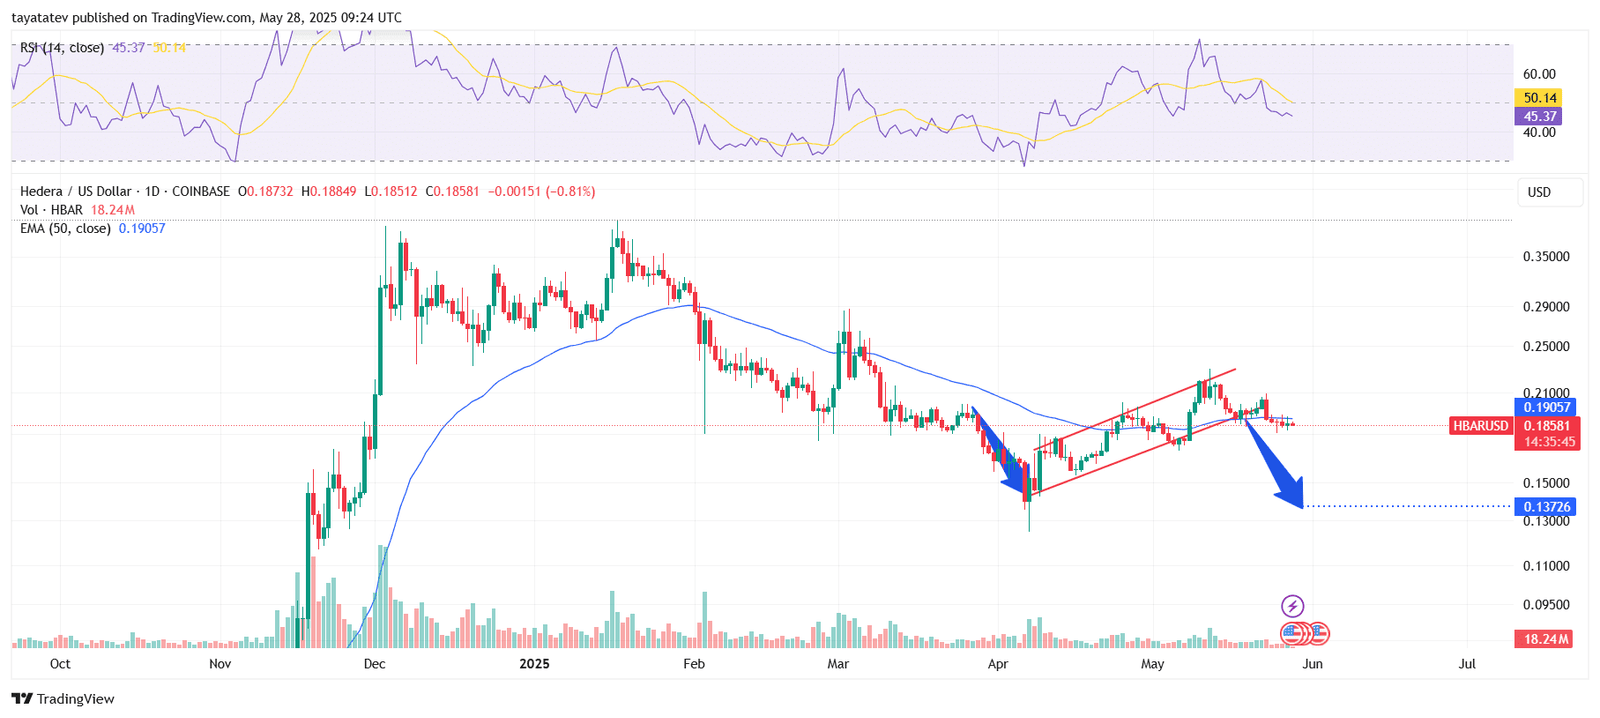
Currently, the price of Hedera (HBAR) is $0.1858 on Coinbase. The token has dropped about 7% since forming the bearish flag. If the pattern confirms, the price could fall another 26% from the current level, targeting the $0.1372 support area marked by the projection.
The 50-day Exponential Moving Average (EMA) stands at $0.1905, just above the current price. This position reinforces resistance overhead and signals ongoing downward pressure.
The Relative Strength Index (RSI) is 45.37, which is below the neutral 50 level. This reading shows growing bearish momentum, though not yet in oversold territory.
The trading volume is steady at 18.24 million, showing no major spike in buying interest during this decline. The pattern follows a prior drop from early April, visible on the chart as a long red candle, confirming a clear directional trend.
If HBAR breaks below $0.18 with increased volume, the bearish flag could confirm and pull the price toward $0.1372, possibly revisiting the March lows near $0.13.
HBAR MACD Turns Bearish as Liquidation Risk Rises
The Moving Average Convergence Divergence (MACD) indicator for HBAR has triggered its first bearish crossover in nearly seven weeks. On May 28, 2025, the MACD line (blue) crossed below the signal line (orange), confirmed by a red histogram bar. This crossover signals a shift in momentum from bullish to bearish.
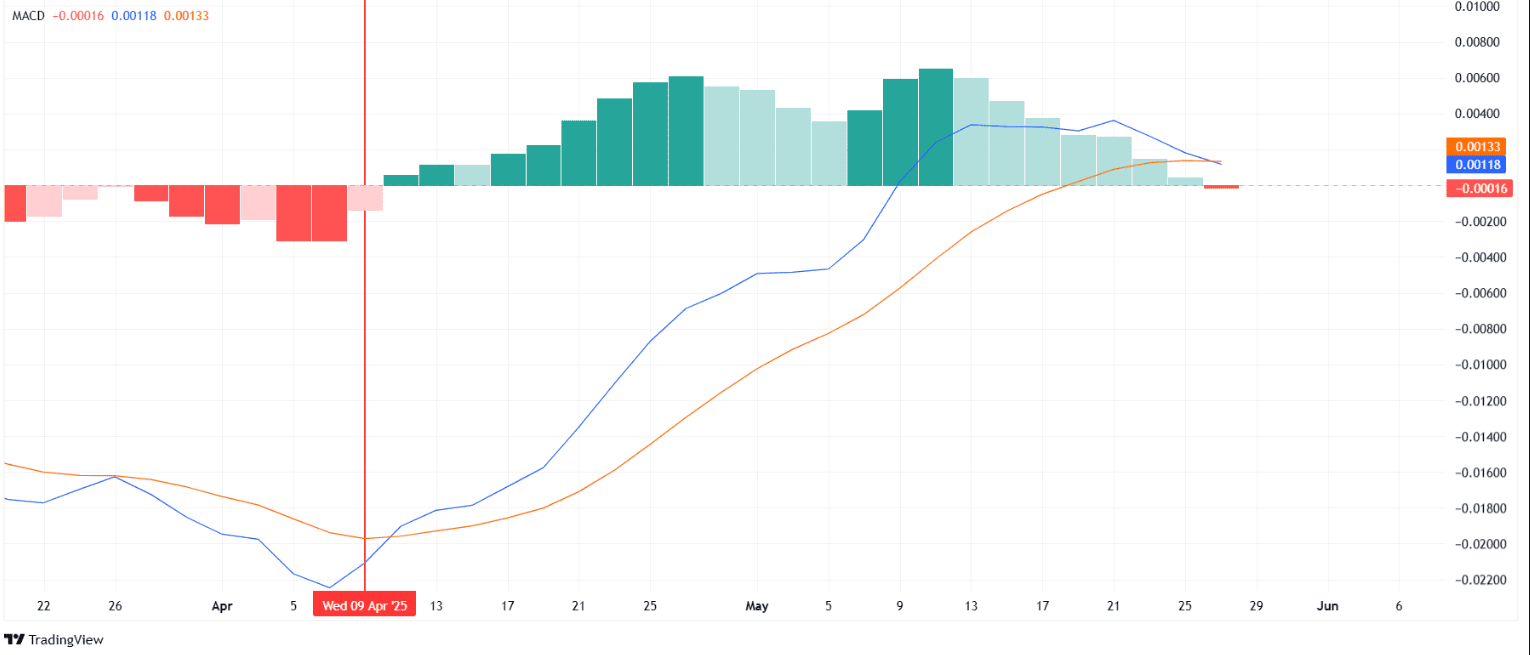
Such crossovers typically indicate rising selling pressure. The momentum reversal suggests that Hedera (HBAR) could enter a downtrend, as the MACD now moves below the zero line. The histogram also continues to shrink, showing fading bullish strength and increasing weakness.
At present, the MACD stands at 0.00118, while the signal line is higher at 0.00133. The red histogram bar at -0.00016 confirms the bearish transition. This pattern reflects waning demand and growing downward pressure.
According to liquidation data, if HBAR drops to $0.172, over $55 million in long positions could be liquidated. That level now acts as a key short-term support zone. A breakdown below it could accelerate the decline, adding to bearish momentum and reducing bullish confidence.
Overall, the MACD crossover adds to the earlier bearish flag pattern, strengthening the bearish bias for HBAR in the near term.
HBAR Faces Liquidation Pressure at $0.1729 Level
The liquidation risk around the $0.1729 mark puts additional pressure on HBAR’s short-term price outlook. According to the Bitget HBAR/USDT liquidation map from Coinglass, this price level holds $55.21 million in cumulative long liquidations. If HBAR falls to this support, it may trigger a wave of forced sell-offs.
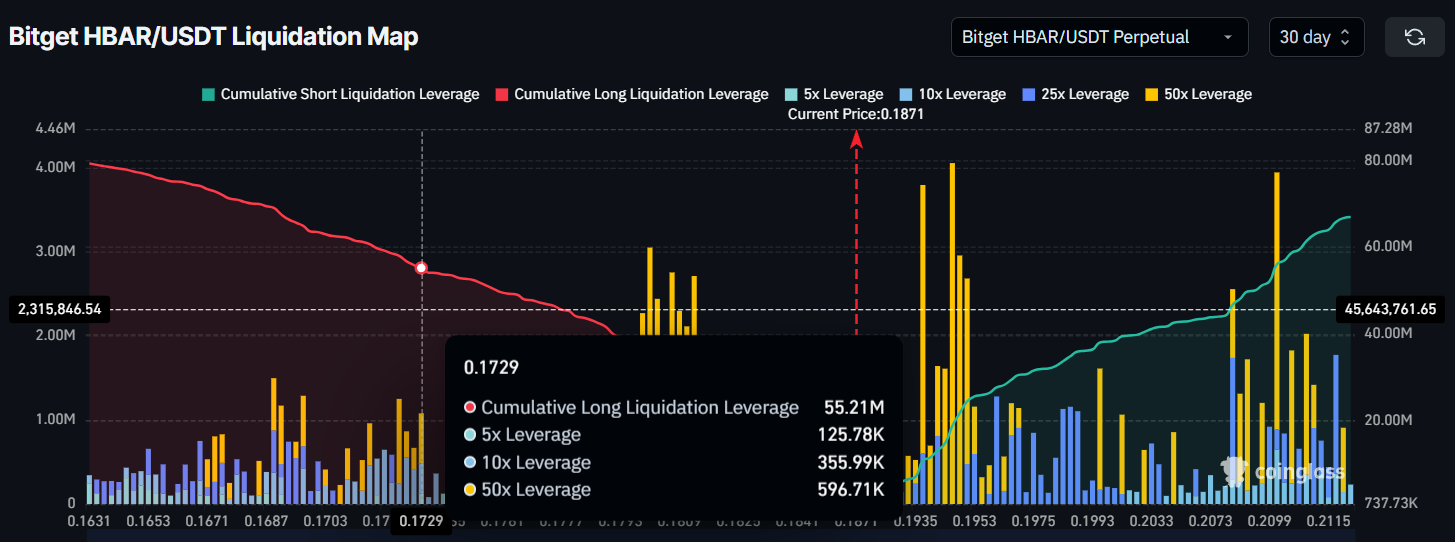
The data shows high exposure from leveraged positions:
5x leverage accounts for $125,780
10x leverage totals $355,990
50x leverage adds another $596,710
A drop of just 1.4 cents would put these leveraged positions at risk. If triggered, these liquidations could accelerate downward momentum, shaking investor confidence and increasing price volatility.
This looming liquidation cluster reflects how tightly the current market is stretched. As a result, market participants may respond cautiously. They are likely watching the $0.1729 support closely, knowing that a breakdown could deepen losses and reinforce the existing bearish sentiment.
