Hedera is facing downward pressure, with analysts warning that HBAR may bleed another $30 million in market value if the $0.20 support fails. The token has slipped under a descending triangle formation, and its failure to reclaim major moving averages signals that more losses could follow.
Analyst Warns HBAR Could Lose $30M as Bears Eye Breakdown Below $0.20
According to analyst EazyWorld, Hedera’s chart is showing signs of weakness that place the $0.20 level at risk. The descending triangle that had been forming since August finally broke lower, confirming the bearish structure.
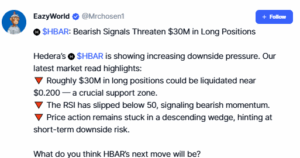
The analyst explained that this pattern reflects fading demand, where buyers have been unable to defend higher levels while sellers have steadily pushed the price down. EazyWorld noted specifically that “Roughly $30M in long positions could be liquidated” and expects further bleeding if HBAR price closes below $0.20 in the coming sessions.
The estimate of a $30 million drop in market capitalization is based on Hedera’s recent trading volume and liquidity map. Data shows bullish traders are already taking heavy losses. Traders liquidated over $431,000 in HBAR positions in the last 24 hours, with longs losing $370,000 compared with just $60,000 in shorts. This imbalance indicates that leveraged long traders are being forced out as price grinds lower, adding to selling momentum.
Weak Momentum and Triangle Breakdown Point to Deeper Losses
The technical picture for Hedera has weakened sharply. The descending triangle that guided price since August broke to the downside this week. In technical terms, this type of pattern usually means that the market is preparing to extend its earlier downtrend. In this case, it confirms that sellers are steadily overwhelming buyers.
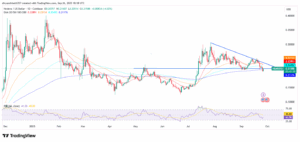
HBAR has also struggled to climb above its short- and medium-term moving averages. The 20-day, 50-day, and 100-day exponential moving averages, all clustered between $0.22 and $0.23, have become a barrier. Every attempt to rebound into this zone has been met with renewed selling, showing that these levels now act as resistance.
At present, the token is sitting almost exactly on the 200-day exponential moving average at $0.2117. Traders often view this line as a dividing point between long-term bullish and bearish trends. If HBAR falls below it and closes lower, the breakdown would erase one of the last strong support levels left on the chart.
Momentum signals confirm this weakness. The Relative Strength Index (RSI), which measures the balance between buying and selling, stands at 38. A reading below 50 shows that sellers are in control. With the RSI still above the oversold threshold of 30, there remains room for additional downward pressure.
If the $0.20 support gives way, the analyst projects a short-term move toward $0.18, which lines up with a zone where Hedera price consolidated earlier this year. In a deeper bearish phase, the token could slide to $0.16, where larger liquidity pools are positioned. By contrast, if $0.20 holds and sparks a rebound, the analyst sees upside capped between $0.22 and $0.24. The clustering of moving averages and sell orders in that zone makes a strong recovery unlikely for now.
