Hedera HBAR Price Poised for 81% Surge as Bullish Patterns and Indicators Align

Tatevik Avetisyan
By Tatevik Avetisyan 6 Min Read
HBAR Price Poised for 81% Surge as Bullish Patterns and Indicators Align

HBAR has posted two straight weeks of significant negative net flows, with –$46.49 million followed by –$40.85 million. This sustained outflow shows tokens are moving off exchanges, a typical bullish indicator that reflects investor confidence and reduces immediate sell pressure.

HBAR Spot Inflow/Outflow. Source: Coinglass

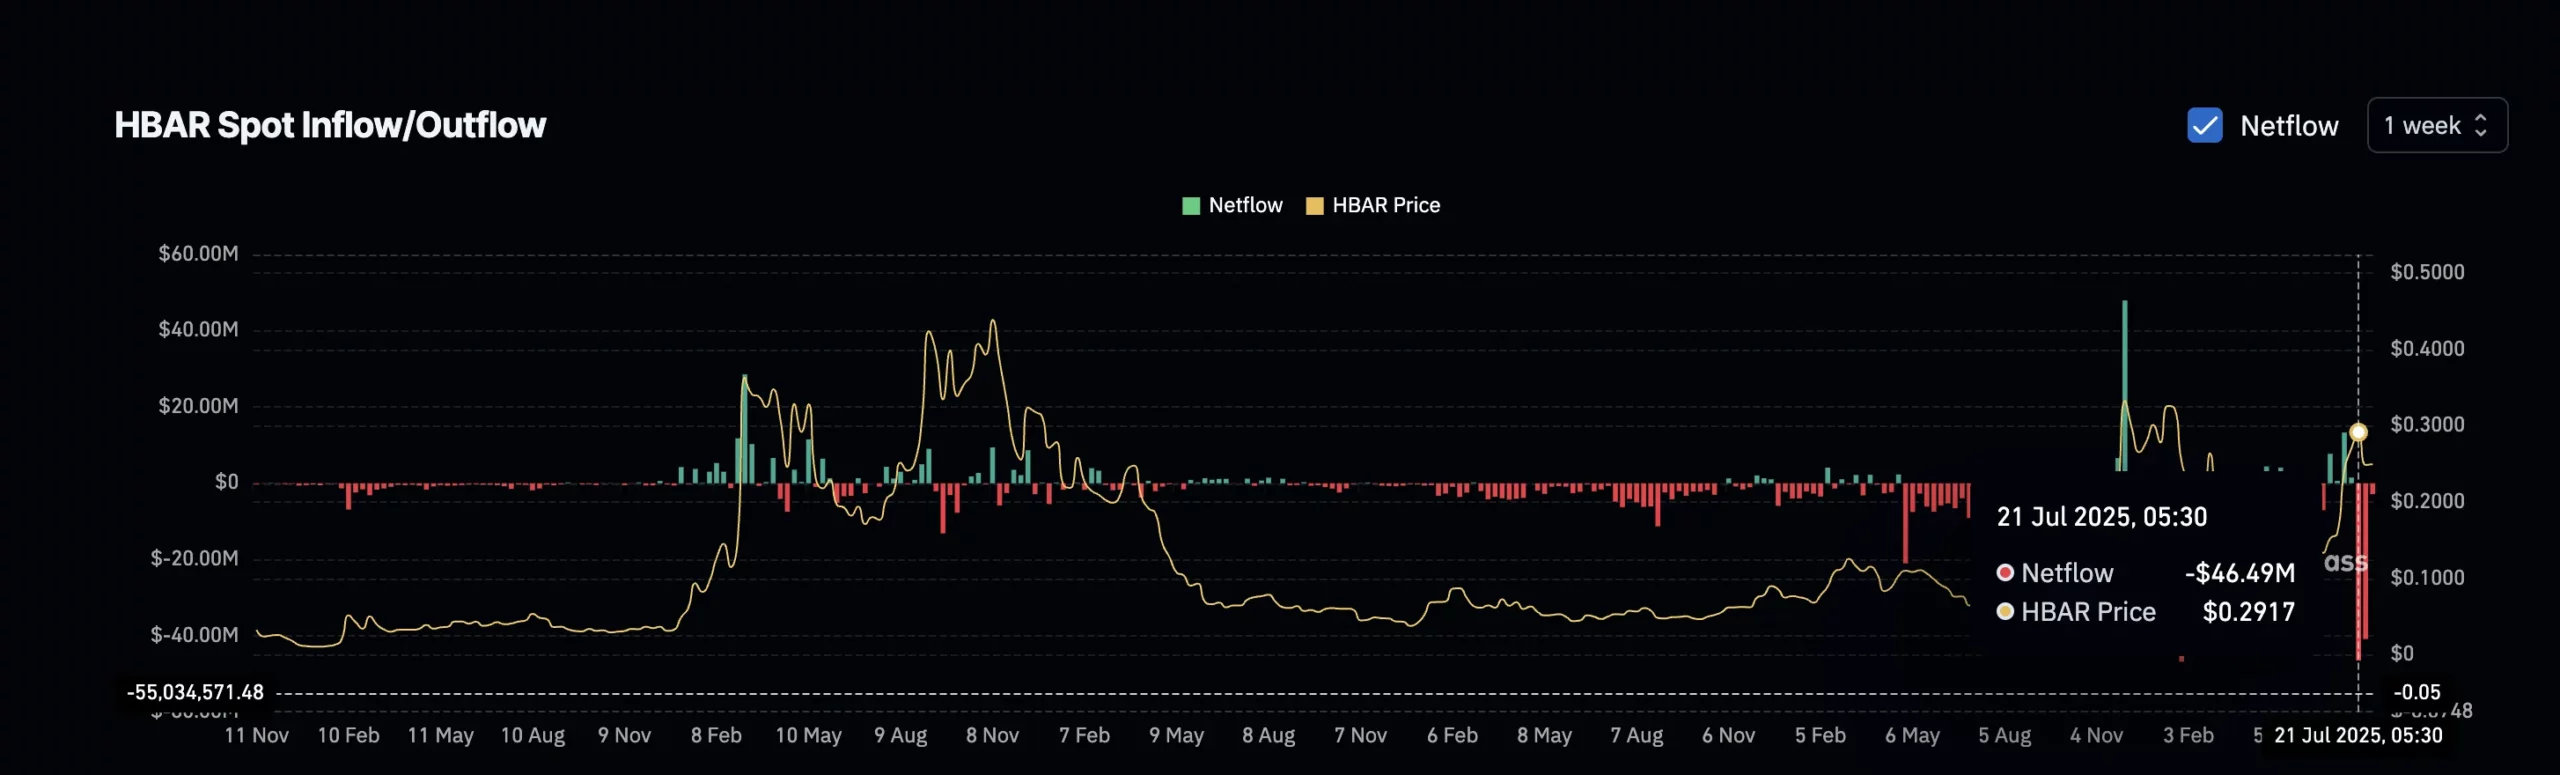
As the new week begins, traders should monitor upcoming outflow data closely. If HBAR records a third consecutive week of negative net flows, it would reinforce the ongoing accumulation trend.

- Advertisement -

Adding to this outlook, Binance’s long-short account ratio stands at 1.83, showing that nearly two-thirds of traders hold long positions.

Binance HBARUSDT Long/Short (Accounts). Source: Coinglass

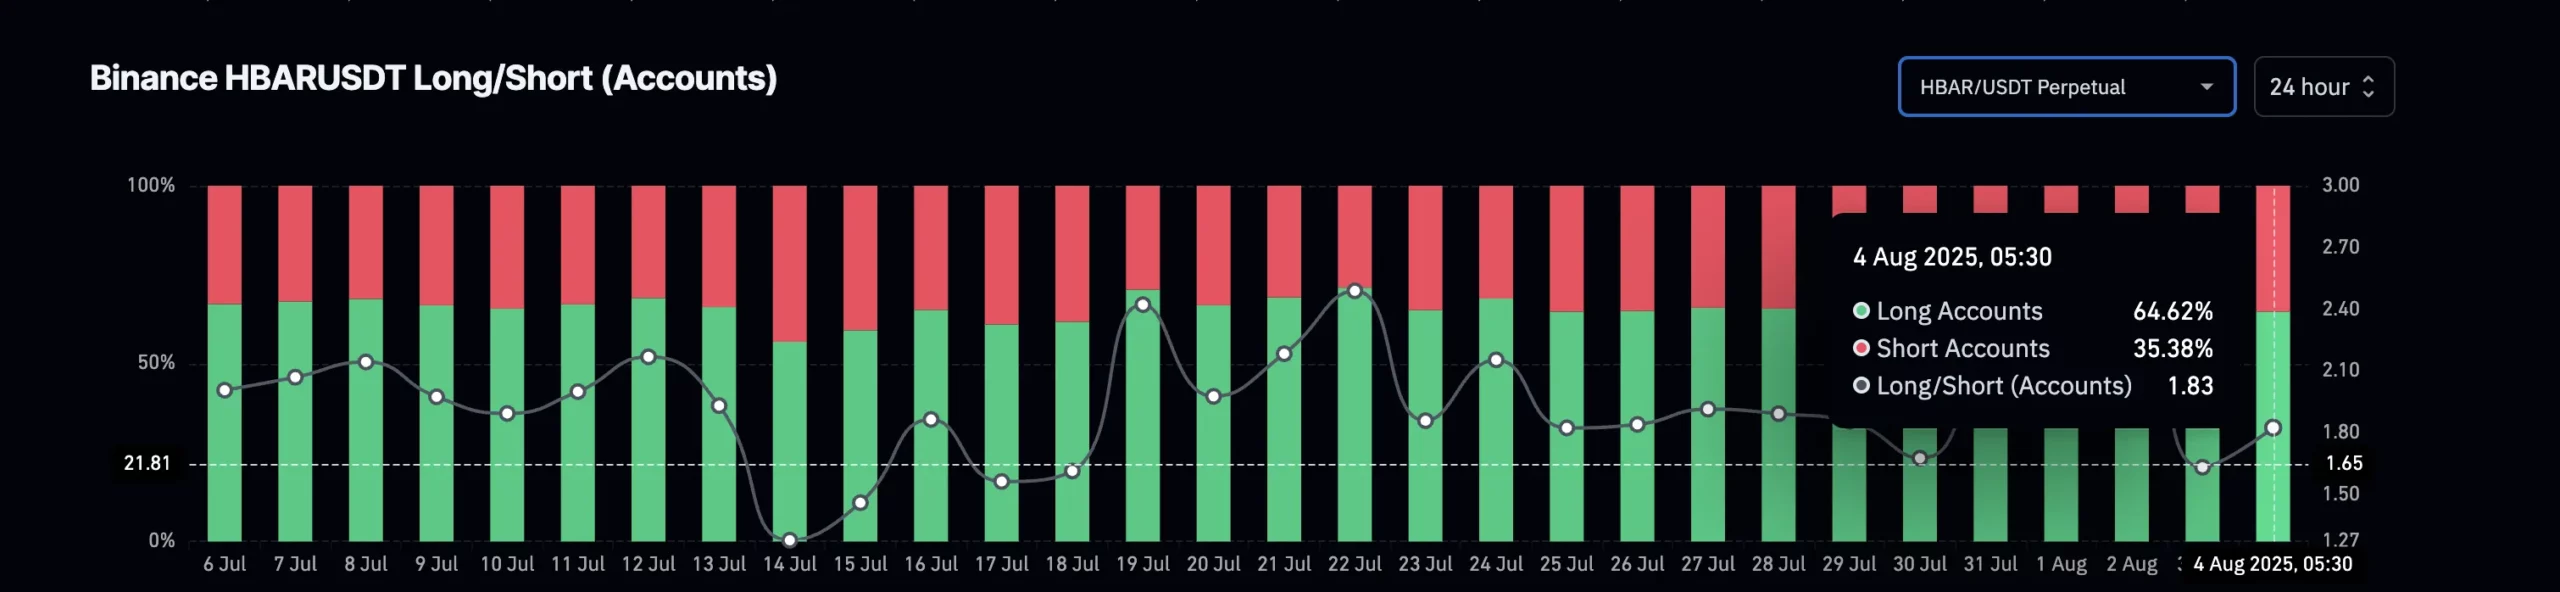
Unlike volume ratios that focus on trade sizes, this metric highlights the number of traders expecting price gains. Together, the consistent outflows and strong long-position dominance confirm a bullish shift in HBAR’s market structure.

HBAR Forms Bullish Channel Pattern

The HBAR/USD chart, created on August 4, 2025, shows a clear bullish channel pattern. A bullish channel pattern occurs when the price moves between two upward-sloping parallel lines, with higher highs and higher lows forming consistently. This pattern signals sustained buying pressure and often indicates further upward momentum if the price respects its boundaries.

- Advertisement -
HBAR/USD 4-Hour Chart. Source: TradingView

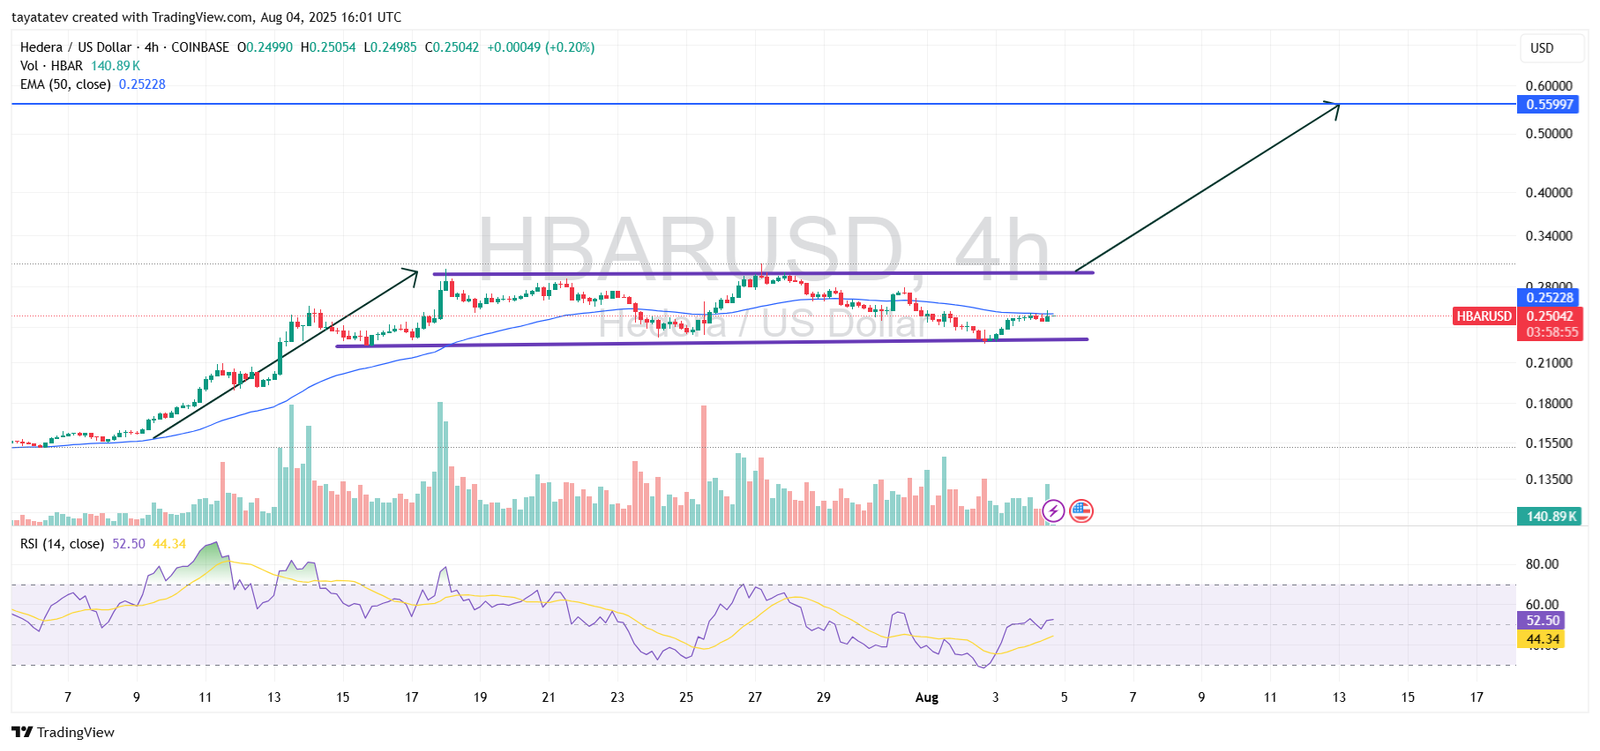
HBAR has been trading within this bullish channel, bouncing between support and resistance levels while staying above the 50-period Exponential Moving Average (EMA). The Relative Strength Index (RSI), which stands for Relative Strength Index, is at 52.50, showing neutral momentum with room for further upward movement.

This pattern confirms a strong bullish structure. If HBAR maintains this channel, it could validate an 81 percent potential rally from its current price of $0.25042 toward $0.55997. The consistent upward structure, combined with support from the EMA and neutral RSI positioning, supports the probability of this price target.

HBAR MACD Signals Bullish Momentum

The HBAR Moving Average Convergence Divergence (MACD) chart, created on August 4, 2025, shows a clear bullish crossover. The blue MACD line has crossed above the orange signal line, which often signals a shift from bearish to bullish momentum. This crossover is supported by the histogram turning positive, indicating increasing buying strength.

HBAR MACD Chart. Source: TradingView

The MACD, which stands for Moving Average Convergence Divergence, measures the relationship between two exponential moving averages to identify trend direction and momentum changes. When the MACD line crosses above the signal line and the histogram moves upward, it reinforces a bullish outlook.

This current setup confirms growing upward pressure. Combined with the earlier bullish channel pattern on the price chart, this MACD crossover strengthens the case for a potential price increase. If momentum continues to build, it supports the projection of HBAR rising toward the $0.55997 target, marking an 81 percent gain from its current price.

HBAR Directional Movement Index Indicates Strengthening Trend

The HBAR Directional Movement Index (DMI) chart, created on August 4, 2025, highlights a strengthening trend structure. The DMI consists of three key components: the Positive Directional Indicator (DI+), the Negative Directional Indicator (DI–), and the Average Directional Index (ADX). The DI+ line, shown in blue, currently stands at 20.75, while the DI– line, shown in red, is at 17.02. The ADX line, in orange, measures 15.28.

HBAR DMI Chart. Source: TradingView

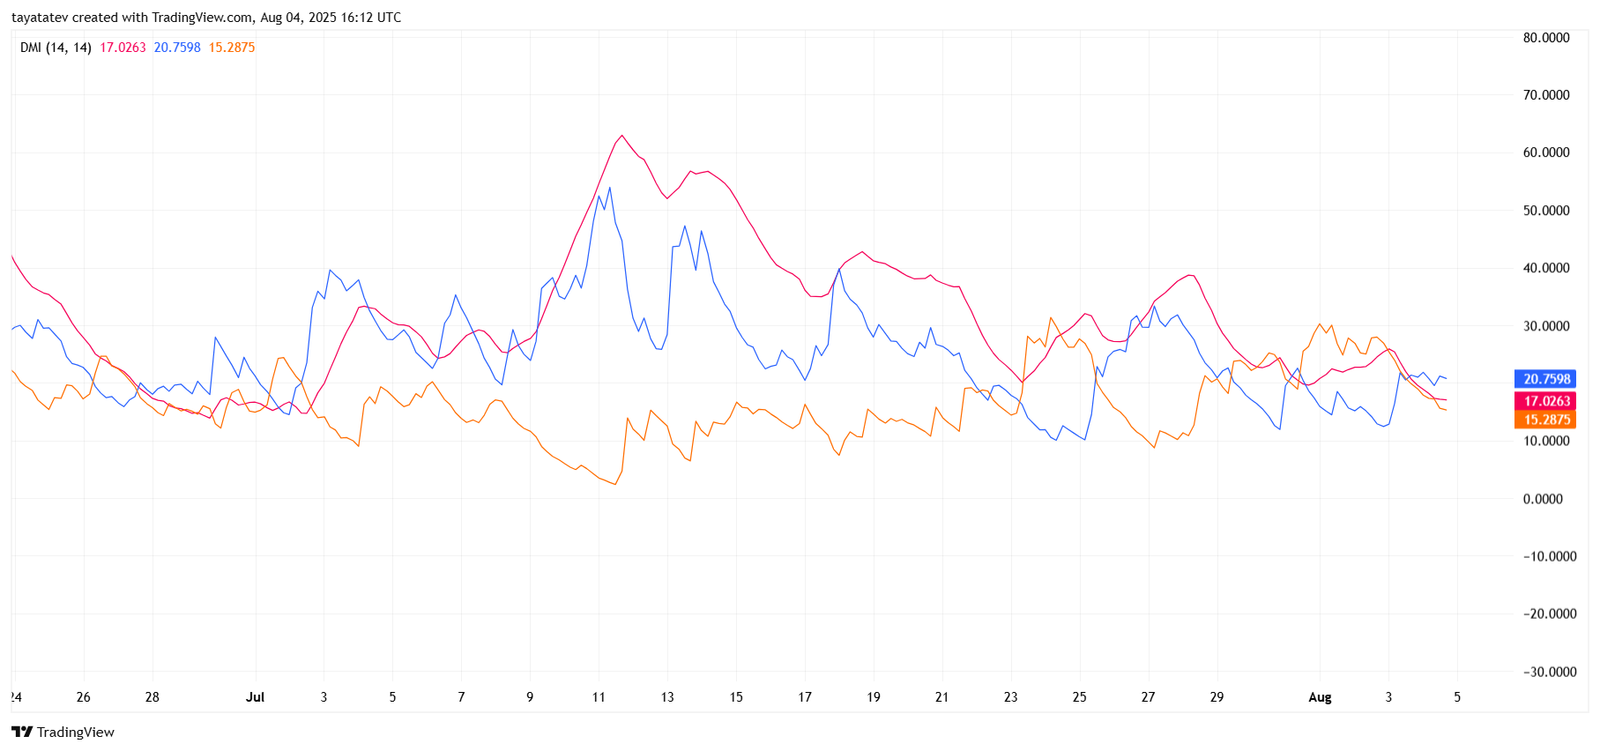
When DI+ stays above DI–, it indicates that buyers hold control. Here, DI+ remains higher than DI–, suggesting bullish pressure is building. However, the ADX level, which signals trend strength, is still relatively low but gradually rising. A climbing ADX above 20 would confirm a stronger trend direction, supporting upward momentum.

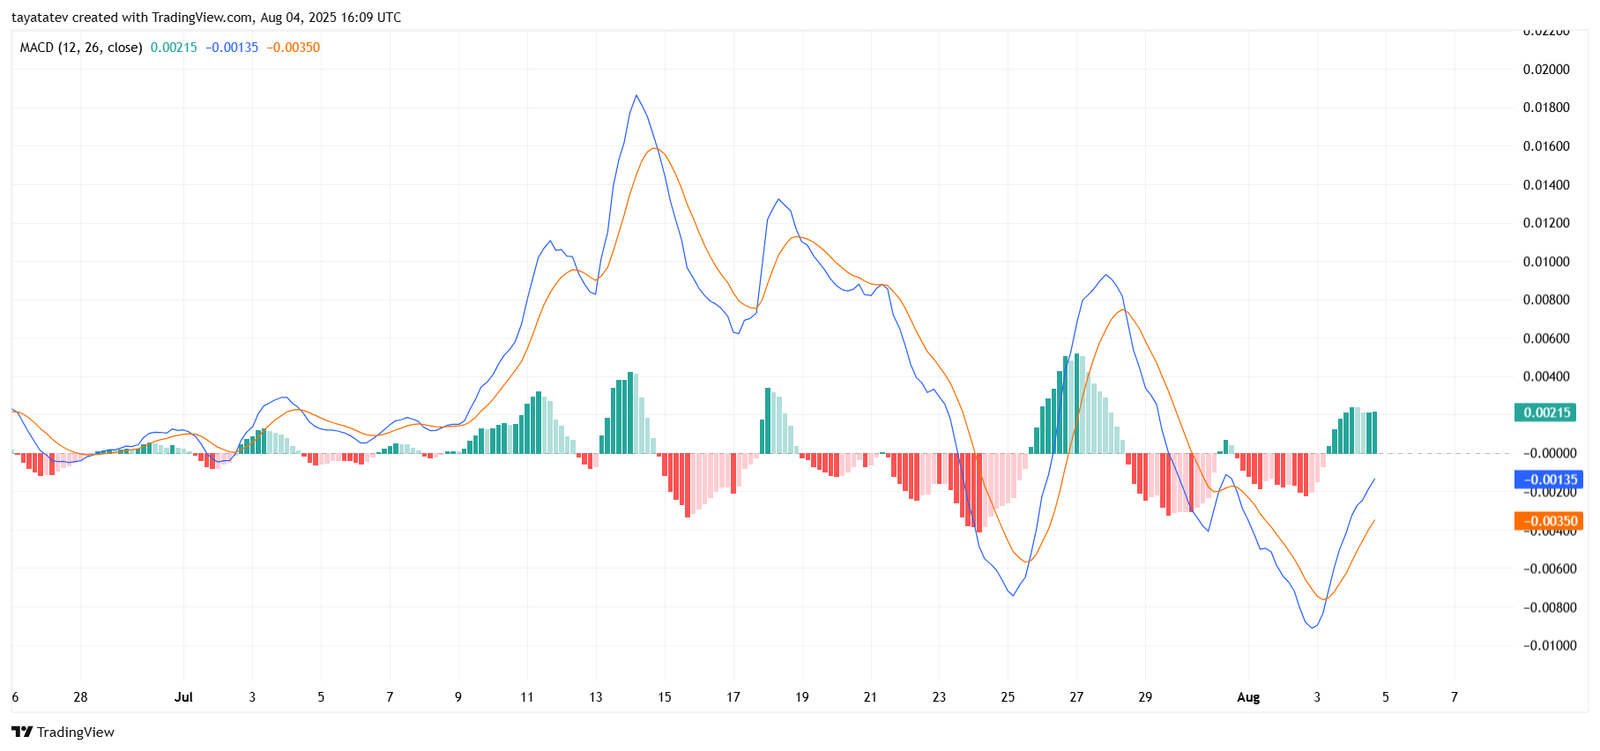
This alignment between DI+ and DI– points to growing buyer dominance, though the ADX implies the trend is still in its early phase. Combined with the bullish channel pattern and MACD crossover, this DMI reading reinforces the possibility of HBAR’s price advancing further toward the projected $0.55997 target.

HBAR Stochastic Momentum Index Signals Ongoing Uptrend

The HBAR Stochastic Momentum Index (SMI) chart, created on August 4, 2025, shows clear bullish momentum. The SMI, which measures the position of a closing price relative to its range over a set period, indicates overbought or oversold conditions with greater sensitivity than traditional stochastic oscillators.

HBAR SMI Chart. Source: TradingView

Currently, the blue SMI line is at 57.80, while the orange signal line is at 59.32. Both lines remain in the positive zone, confirming strong upward momentum. The SMI has moved out of its recent oversold territory and crossed upward, which aligns with the price recovery and signals renewed buying interest.

This bullish SMI position supports the existing upward trend seen in previous indicators. With both lines maintaining upward movement near the overbought threshold, it signals persistent buying strength that aligns with the projection of HBAR reaching $0.55997, an 81 percent increase from its current price.

Tatevik Crypto Journalist CoinChapter

Tatevik Avetisyan

Tatev Avetisyan is a Markets Writer and Analyst at CoinChapter, covering cryptocurrency markets, policy, and regulation. With over seven years of experience in business and marketing development, she has spent the past two years specializing in digital assets and has authored more than 2,000 articles on crypto markets and regulatory developments.She contributes as a guest writer to leading industry publications and is a prominent Web3 advocate in Armenia through Web3Armenia. Her work reflects a broader focus on artificial intelligence and Web3 technologies. Tatev maintains a diversified crypto portfolio, with Bitcoin as her primary holding above CoinChapter’s $1,000 disclosure threshold.