Hedera (HBAR) rose more than 6% on May 8, 2025, as its market cap approached the $8 billion mark. Trading volume increased by 19%, reaching $176 million, according to data from TradingView. This signaled a renewed interest in HBAR despite earlier bearish trends.
The price surge occurred while key technical indicators showed mixed signals. The Bollinger Band Trend (BBTrend) remains in negative territory. However, the Relative Strength Index (RSI) and Exponential Moving Averages (EMAs) point toward strengthening momentum. Analysts are watching closely to see if HBAR can break key resistance levels or face another pullback.
The current resistance is near the $0.199 level. If broken, HBAR could enter a stronger price range. Failure to do so could lead to a correction, with support levels positioned 33% lower.
Hedera BBTrend at –1.56 Reflects Ongoing Bearish Conditions
The BBTrend indicator for HBAR stood at –1.56 on May 8. This value falls within bearish territory, suggesting downward momentum still affects the token’s price. The BBTrend dropped to –6.76 the previous day, the most bearish level in over a month, before bouncing slightly.
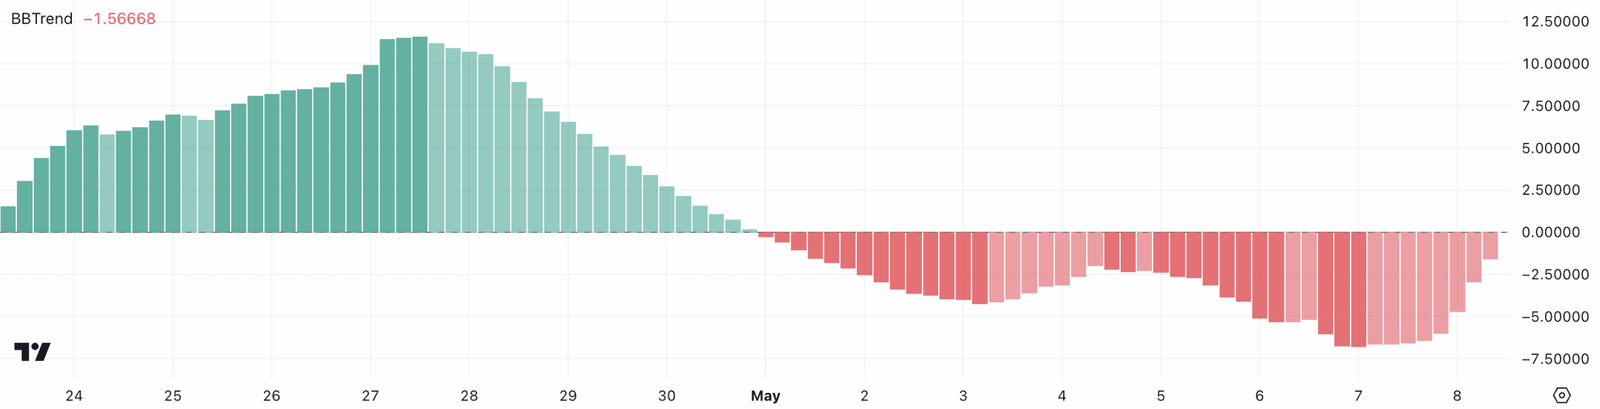
The BBTrend tracks how the price moves relative to Bollinger Bands. It helps assess trend strength. A reading above +1 reflects bullish trends, while below –1 signals bearish movement. The neutral range falls between –1 and +1.
Despite the ongoing negative signal, the slight uptick from the lowest point may suggest easing selling pressure. If the BBTrend continues rising and crosses above –1, it may indicate a pause in the current downtrend.
This comes after several days of intense volatility. As of May 1, BBTrend remained under the –1 mark, highlighting the broader bearish environment. The price activity has since started forming tighter ranges.
HBAR RSI Hits 66.2 After Two-Day Climb From Oversold Zone
The RSI for HBAR climbed to 66.2 on May 8, up from 31.41 just two days earlier. This increase points to a major shift in price momentum, moving the token out of oversold territory.
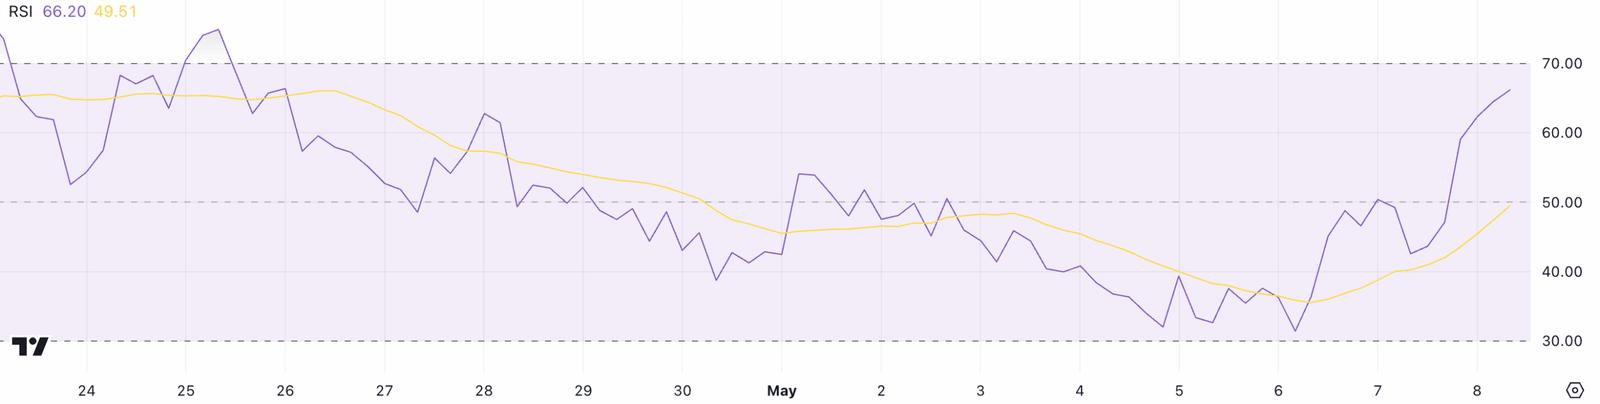
The RSI measures buying and selling pressure on a scale from 0 to 100. Values below 30 indicate oversold levels, while above 70 suggest the asset is overbought. Readings between 50 and 70 indicate building strength within an uptrend.
Currently, HBAR sits just below the 70 mark, meaning it’s close to entering overbought territory. This could mean the asset is gaining strong buying interest. However, if RSI crosses 70 in upcoming sessions, traders may watch for any signs of pullback.
The quick rebound in RSI also aligns with rising volume. Market participants appear to be entering positions more actively, particularly after HBAR tested support levels earlier in the week.
Golden Cross May Form Soon as EMAs Begin to Tighten
Technical charts show Hedera’s 50-period Exponential Moving Average (EMA) is nearing a crossover with the 200-period EMA. This setup is known as a “golden cross,” which usually signals longer-term trend shifts when it occurs.
As of May 8, the EMAs are moving closer, with short-term momentum strengthening. While no crossover has yet occurred, the tightening gap between the averages is significant. Traders often view this as a signal of potential price continuation if volume supports the trend.
EMA crossovers depend on both price action and volume support. HBAR’s volume increase to $176 million suggests market interest is returning. If the current price momentum sustains, the crossover could occur in the short term.
Technical data continues to show opposing forces between recent bearish pressure and strengthening upside momentum. The combination of rising RSI, higher volume, and tightening EMAs keeps HBAR under close market watch.
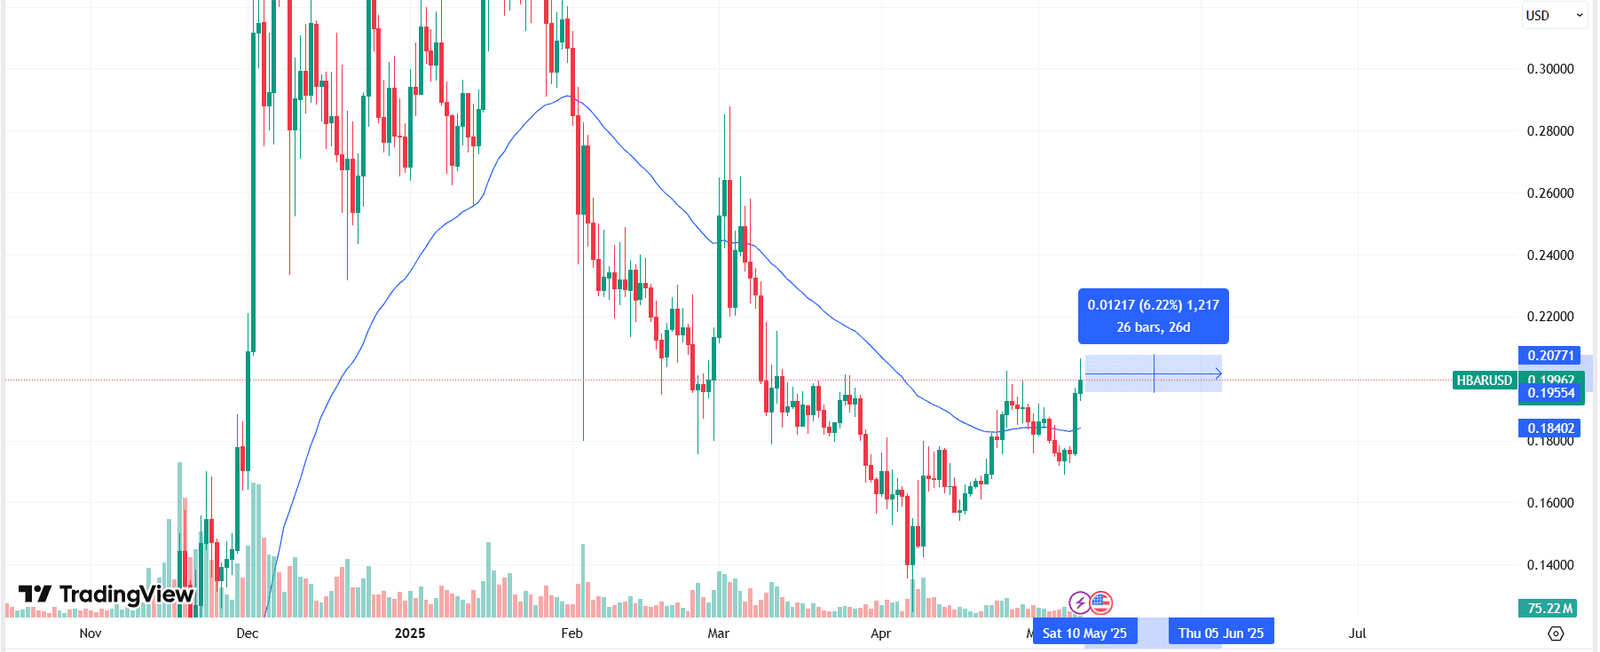
HBAR Forms Bearish Pennant, Faces 60% Drop if Pattern Confirms
Meanwhile, on May 9, Hedera (HBAR) formed a bearish pennant on the daily chart. A bearish pennant is a short-term continuation pattern that appears after a sharp price drop and features converging trendlines. It often signals further downside if the support line breaks.
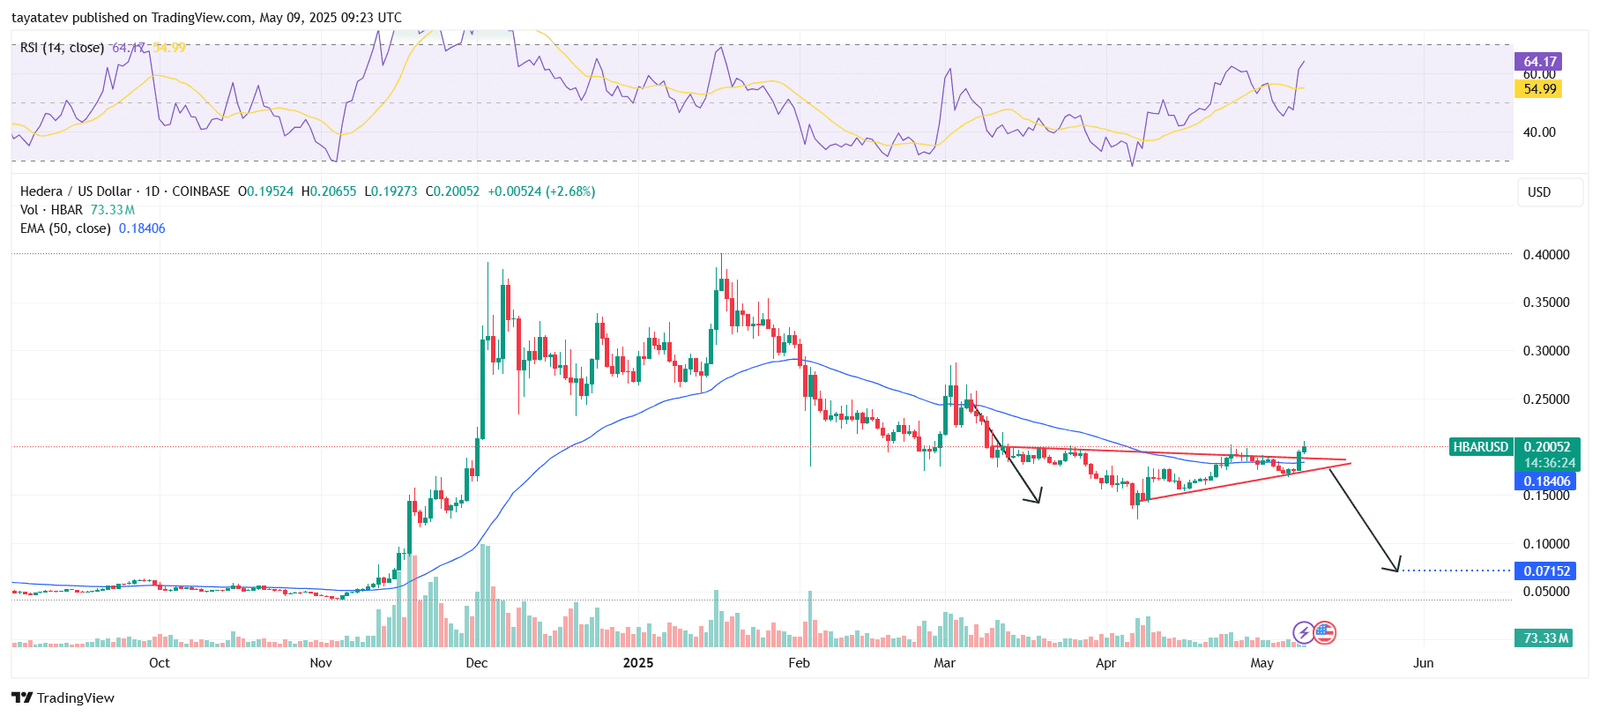
HBAR price jumped 5.9% to $0.20061 after temporarily breaking above the pennant’s upper trendline. Trading volume reached 72.58 million, while the 50-day Exponential Moving Average (EMA) stood at $0.18406. Despite the breakout, arrows marked on the chart suggest a downward continuation remains likely.
If the bearish pennant confirms with a breakdown, the pattern points to a target of $0.07152. That would represent a decline of over 60% from the current level.
At the same time, the Relative Strength Index (RSI) climbed to 64.17, up from 31.41 earlier in the week. This shows strengthening buyer activity, though the value remains just below the overbought level of 70. If price momentum stalls, RSI could shift lower, aligning with a potential bearish continuation.
The setup remains undecided. Traders continue to monitor whether HBAR can hold above $0.20 or reverse downward to test lower support levels near $0.07152.
