
Hedera announced on August 18, 2025, a new release cadence strategy for its distributed ledger platform. The update outlines regular, predictable upgrades to strengthen security and maintain competitiveness.
The move signals a push for greater reliability as the network expands its institutional partnerships and ecosystem activity.
Central Bank and Institutional Use Cases Gain Ground
In July 2025, the Reserve Bank of Australia and the Digital Finance Cooperative Research Centre selected Hedera to participate in a wholesale central bank digital currency pilot. At the same time, Lloyds, Aberdeen, and Archax completed the first tokenized institutional foreign exchange trade on Hedera. These developments highlight the platform’s growing role in financial market infrastructure.
EQTY Lab integrated its Verifiable Compute platform with NVIDIA’s Blackwell architecture, using Hedera to anchor verifiable results. The collaboration underscores Hedera’s ambition to serve as a trusted layer for enterprise-grade compute and data applications.
Meanwhile, Hedera reported that its “To Earn” program surpassed 24 million users. In parallel, the “Hello Future Hackathon” opened with a $550,000 prize pool to attract new developers. Technical teams also launched Hedera Agent Kit v3, introduced new Hedera Improvement Proposals, and began consolidating projects into a unified namespace called Hiero.
Open-Source Transition Under Linux Foundation
In a structural shift, Hedera’s core software moved under the Linux Foundation’s Decentralized Trust project as “Hiero.” This transition makes the software open source, enhancing transparency and collaboration across the ecosystem. Analysts see the move as a step toward long-term institutional adoption by improving governance clarity.
A June 2025 academic study evaluated consensus power distribution across major blockchain networks. The findings showed Hedera maintains a more balanced distribution of consensus power compared to Ethereum and Cardano, suggesting greater decentralization within its governance model.
Hedera (HBAR) Forms Bullish Pennant Pattern With 108% Upside Potential
HBAR/USD has developed a bullish pennant pattern, a technical formation that appears after a sharp price surge. The pattern combines a strong upward move, followed by converging trendlines that represent short-term consolidation. Traders view this structure as a signal of potential continuation once the consolidation resolves.
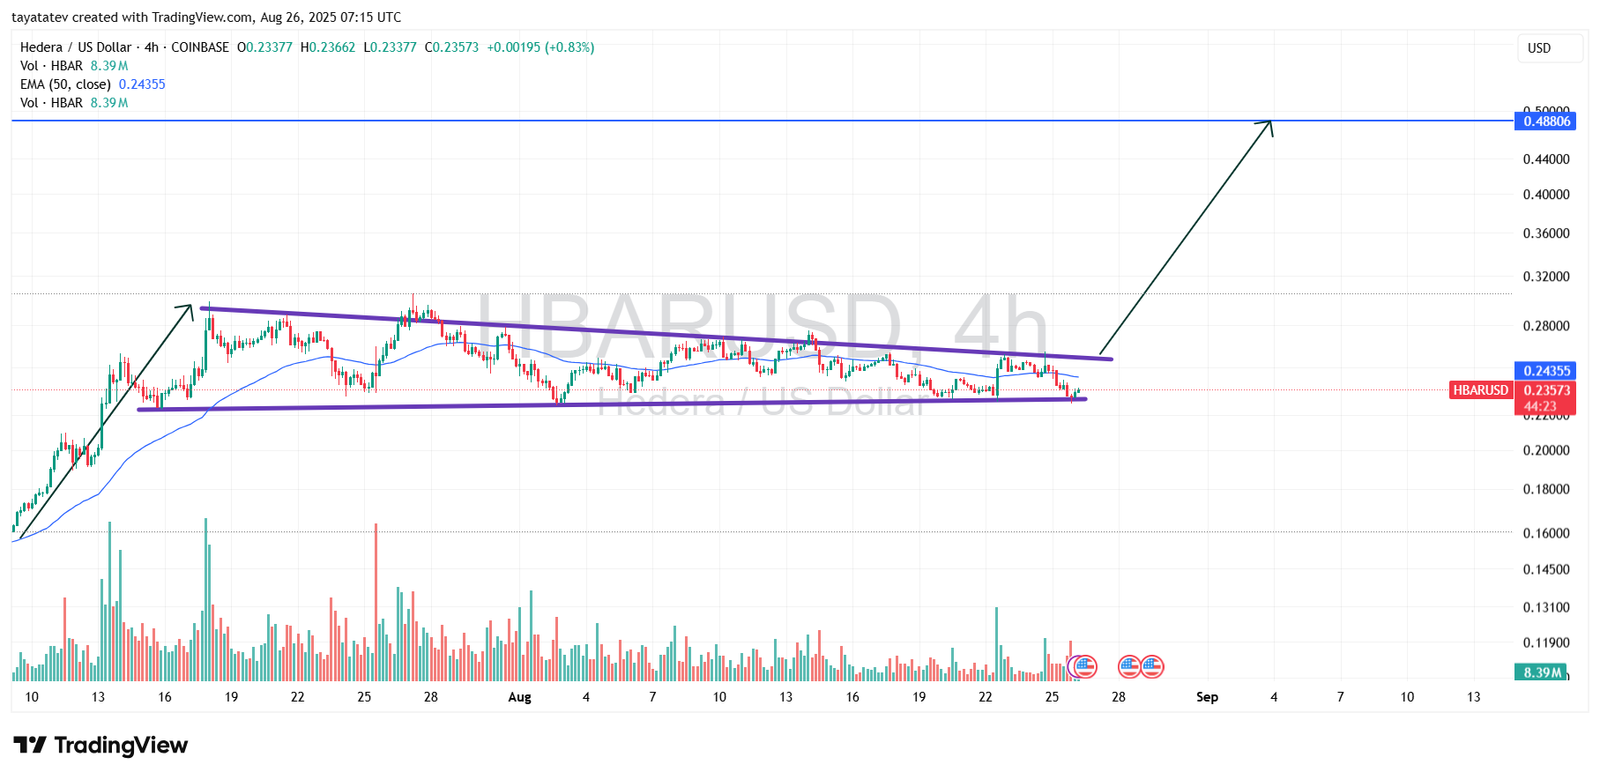
A bullish pennant typically confirms when price breaks above the upper boundary with strong volume. Based on the measured move projection, the upside target sits near $0.488, implying a potential 108 percent increase from the current trading level of $0.235.
The 50-period Exponential Moving Average (EMA) is currently positioned near $0.243. Price action is consolidating just below this dynamic level, suggesting that the EMA is acting as short-term resistance. A decisive break above the EMA would add confirmation to the bullish scenario and signal strengthening upward momentum.
Trading volume has fluctuated during the consolidation, with spikes during upward attempts and muted flows during declines. The latest four-hour candle shows approximately 8.39 million HBAR in volume, consistent with accumulation behavior inside the pennant. Sustained higher-than-average volume will be critical in confirming a breakout toward the projected target.
HBAR’s chart structure, supported by the bullish pennant, EMA positioning, and volume dynamics, indicates a strong technical setup. If the pattern confirms with a breakout above resistance and expanding volume, price may rally to the $0.488 region, more than doubling from current levels.
Hedera (HBAR) RSI Signals Neutral Zone With Bearish Pressure
The chart was created on August 26, 2025, using the four-hour timeframe for Hedera (HBAR) against the United States Dollar (USD). The indicator applied is the Relative Strength Index (RSI) with a 14-period setting, alongside its moving average signal line.
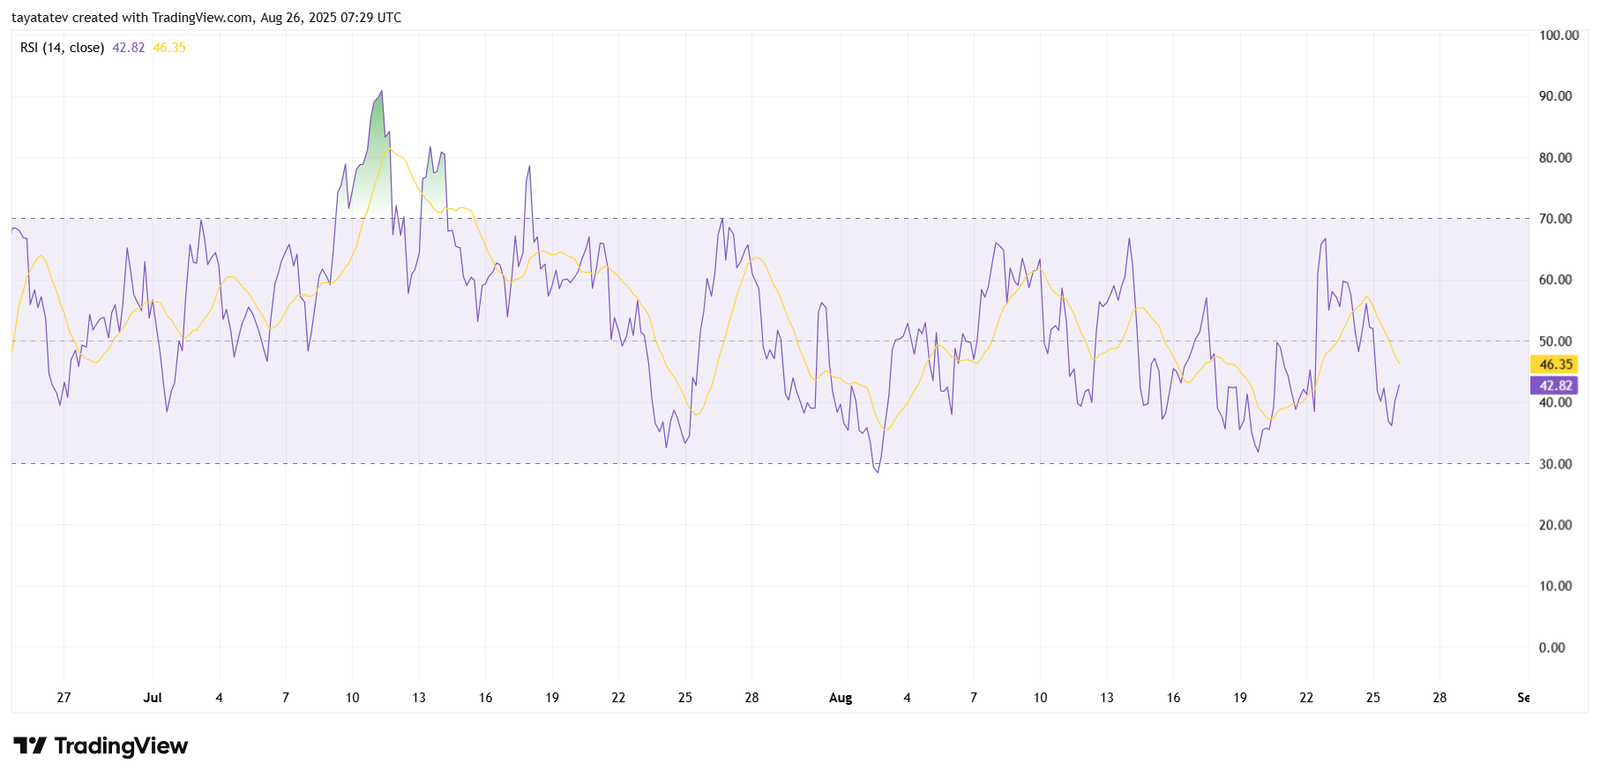
The RSI is currently at 42.82, with the signal line at 46.35. This level places the index in the neutral-to-weak range, below the midpoint of 50. The RSI has been trending lower in recent sessions, showing that bearish momentum is slightly outweighing bullish pressure.
When the RSI trades between 30 and 50, it indicates weak buying interest and suggests that sellers are gradually exerting more influence. The fact that the RSI is below its signal line reinforces a short-term bearish bias. However, since the indicator remains above the oversold threshold of 30, the market is not yet in extreme selling conditions.
If RSI continues to hold between 40 and 50, HBAR may remain in consolidation before confirming a new direction. A rebound above 50 would strengthen bullish momentum, while a drop closer to 30 could increase the risk of deeper pullbacks.
Hedera (HBAR) MACD Turns Negative, Bearish Momentum Builds
The chart was created on August 26, 2025, showing the Moving Average Convergence Divergence (MACD) indicator for the Hedera (HBAR) to United States Dollar (USD) trading pair on the four-hour timeframe. The indicator uses the standard 12-26 settings with a 9-period signal line.
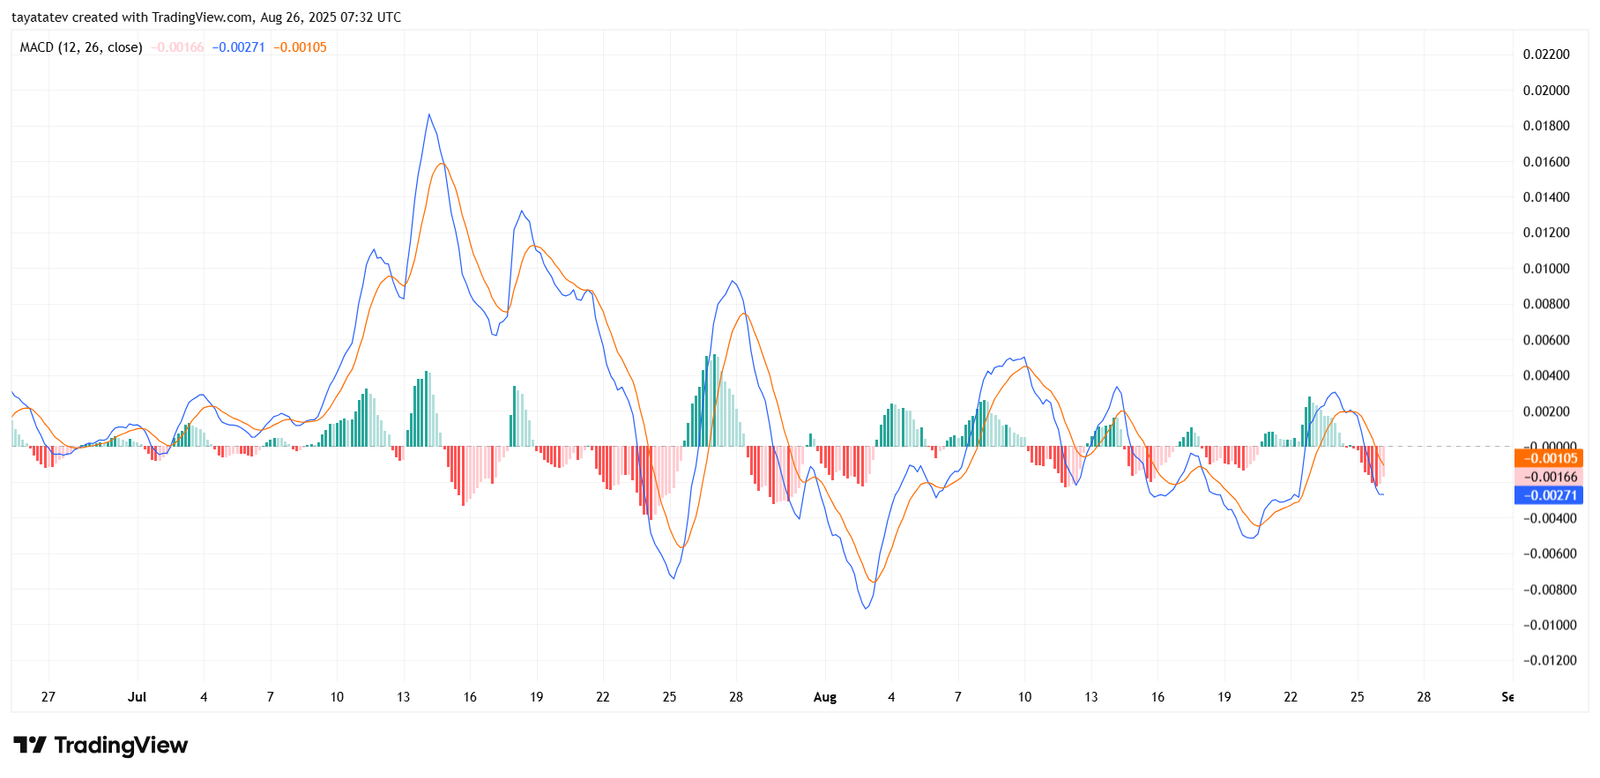
The MACD line is currently at -0.00271, while the signal line is at -0.00105. Since the MACD line is below the signal line, the indicator reflects short-term bearish momentum. This crossover to the downside suggests sellers are exerting stronger control in recent sessions.
The histogram bars are in red and trending lower, reinforcing the bearish signal. This negative momentum indicates weakening buying strength and the potential for continued downward pressure unless a reversal occurs.
As long as the MACD line remains below the signal line and the histogram stays negative, HBAR could face further selling pressure. A reversal would require the MACD line to cross above the signal line with green histogram bars, signaling renewed bullish momentum.
Hedera (HBAR) Stochastic Momentum Index Signals Weak Momentum
The chart was created on August 26, 2025, using the four-hour timeframe for Hedera (HBAR) against the United States Dollar (USD). The indicator applied is the Stochastic Momentum Index (SMI) with 10, 3, 3 settings, a refined version of the traditional stochastic oscillator.
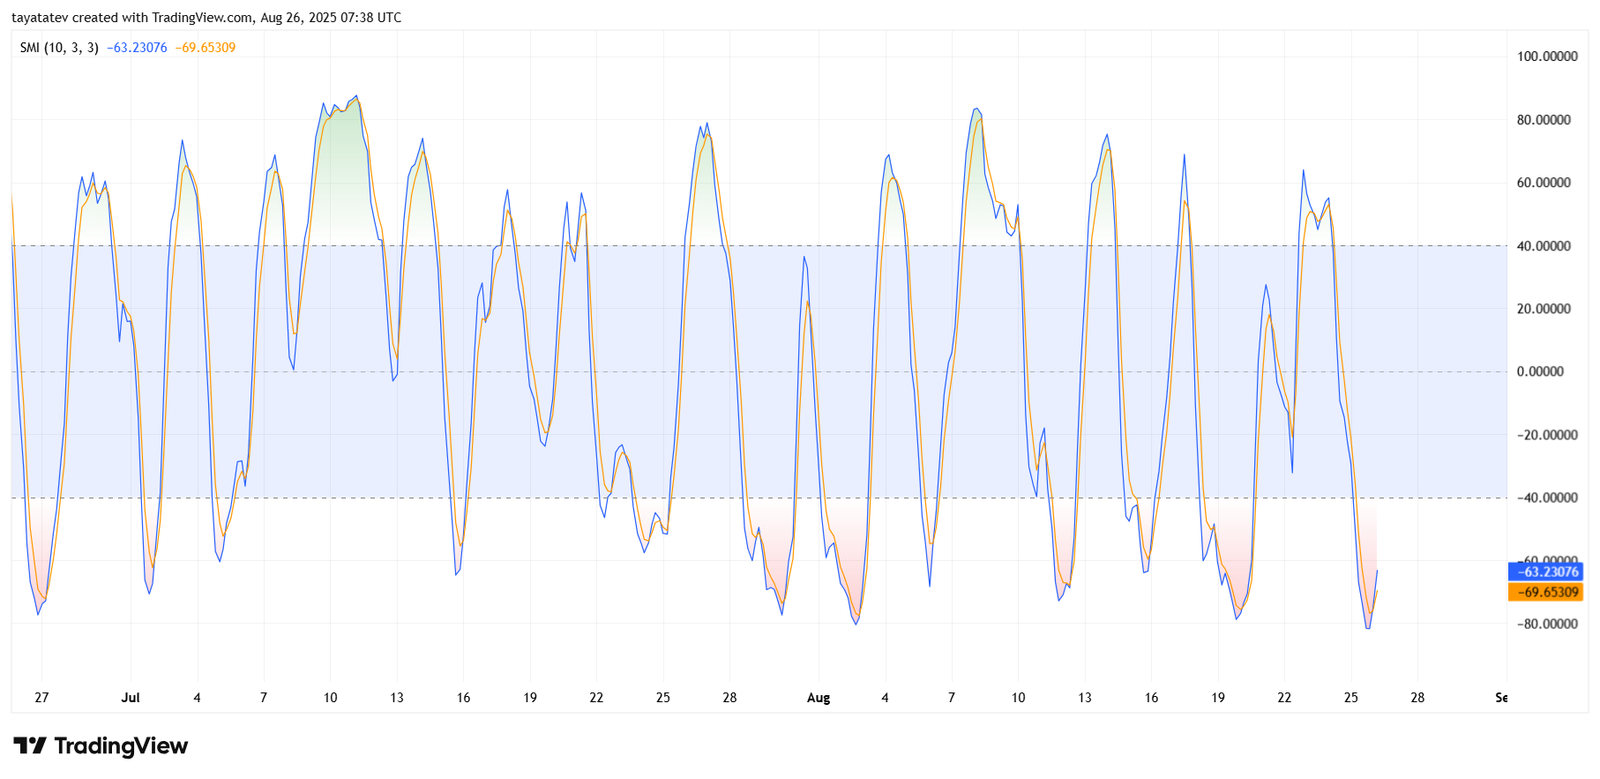
The SMI shows values of -63.23 for the main line and -69.65 for the signal line. Both readings are well below the neutral midpoint of zero, placing HBAR in a bearish momentum zone. The indicator suggests that sellers continue to dominate the market, as the lines remain under negative territory.
When the SMI trades below -40, it typically signals weak momentum with increased selling pressure. The fact that both the SMI and its signal line are in sync reinforces the bearish outlook. However, oversold conditions normally occur closer to -80, meaning the market could still extend its downside before reaching exhaustion levels.
The SMI indicates that Hedera remains under pressure in the short term. If the SMI lines turn upward and cross above -40, it could mark the beginning of a potential recovery. Until then, momentum favors sellers, aligning with recent signals from the MACD and RSI.
