
Hedera (HBAR) may be setting up for a short-term rebound despite flashing a traditionally bearish signal.
HBAR Death Cross May Spark a Countertrend Bounce
Hedera is approaching a death cross on the weekly chart, a setup where the short-term moving average, typically the 50-week EMA (red) slips below the long-term average, like the 200-week EMA (blue).
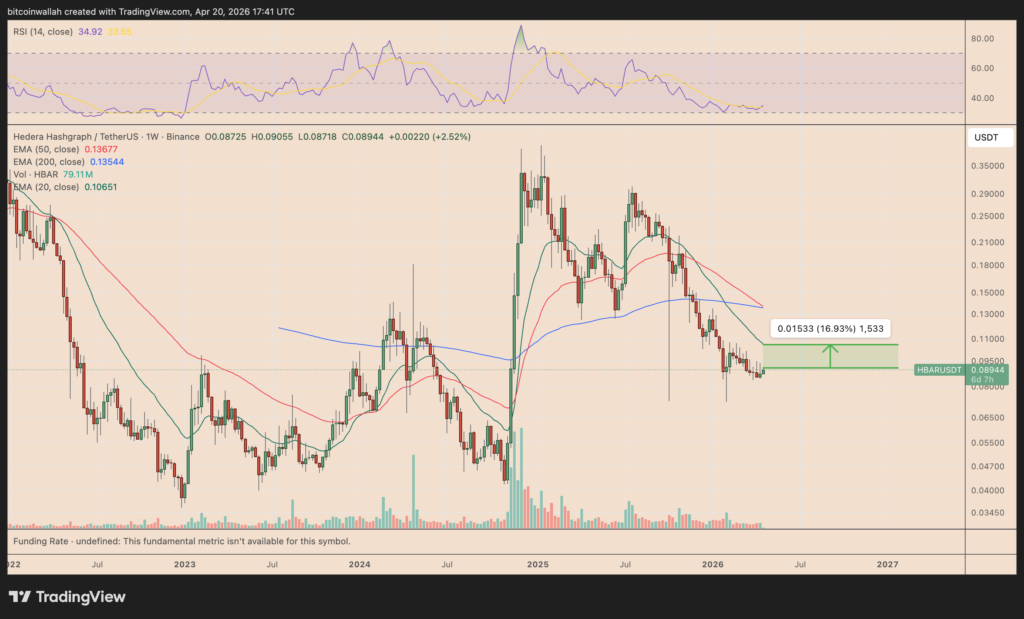
For beginners, this pattern is usually seen as bearish because it confirms that recent prices are weaker than the longer-term trend. But here’s the catch: death crosses are lagging indicators. By the time they appear, much of the selling may have already happened. That’s why markets often react differently than expected.
In some cases, a death cross can actually trigger a short-term relief rally, as sellers get exhausted and bargain buyers step in. HBAR appears to be following that script.
After a prolonged downtrend, the token is stabilizing near the $0.085–$0.09 zone, showing signs of accumulation. If momentum builds, the next logical upside target is the 20-week EMA (green) at around $0.106, roughly 15–17% above current price levels.
Wall Street Shows No Love For HBAR ETFs
Institutional interest in Hedera-linked investment products has cooled, according to ETF flow data provided by SoSoValue.
After brief periods of strong inflows earlier this year, HBAR spot ETFs are now seeing near-zero daily net inflows, signaling a pause in fresh capital entering the market.
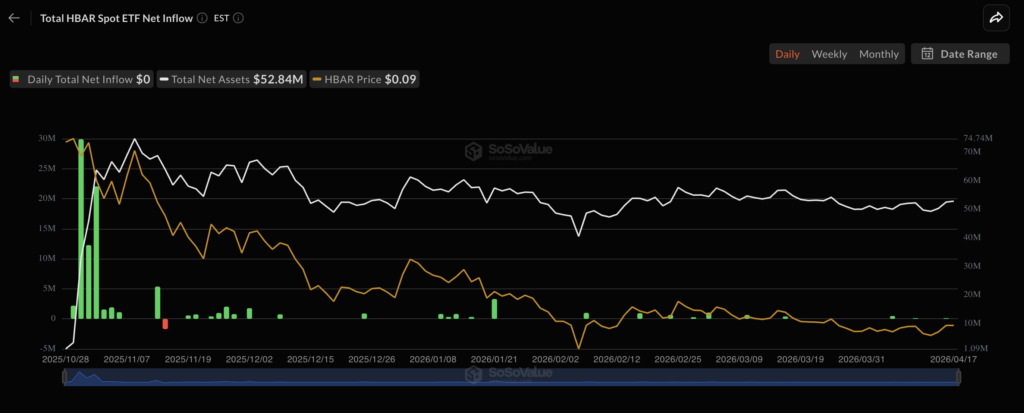
This shift suggests investors are holding existing positions rather than actively accumulating, which aligns with HBAR’s recent price consolidation. Since ETF inflows directly translate into spot buying pressure, the slowdown has removed a key support driver.
Still, the absence of outflows indicates no major institutional exit, keeping downside relatively contained for now.
HBAR’s Liquidation Cluster Hints At Drop Toward $0.085
HBAR’s liquidation heatmap shows a dense cluster of long liquidations around the $0.083–$0.085 range, forming what traders call a magnet zone. These zones often attract price because they represent pockets of leveraged positions that can be force-closed, adding momentum in that direction.
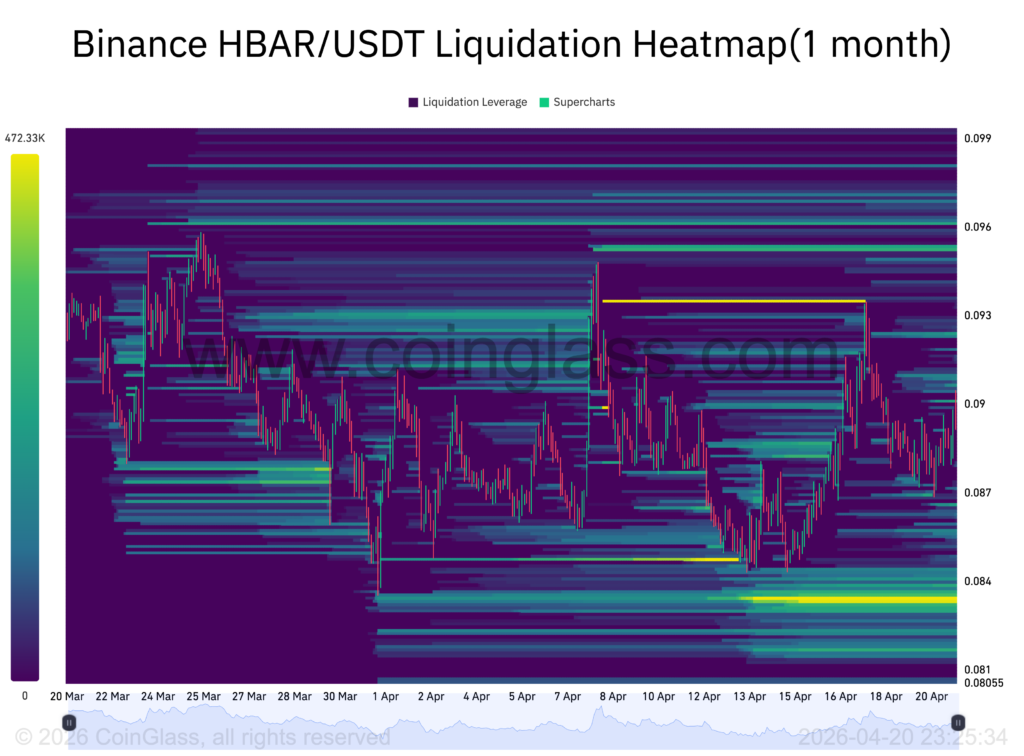
In simple terms, if the price starts moving down, it can trigger these liquidations, creating a cascade effect that accelerates the drop.
If the ongoing death cross–driven relief rally fails to gain traction, this cluster increases the probability of a pullback toward the $0.08 region, where liquidity is heavily concentrated, and downside pressure could intensify.
