KAIO, a company focused on tokenizing real-world assets, has chosen Hedera to bring institutional funds onto the blockchain. The firm confirmed that it has incorporated several distinct funds into its platform.
These include the Laser Digital Carry Fund (LCF), a market-neutral and low-correlation digital asset fund, and the BlackRock ICS US Dollar Liquidity Fund, which aims to maximize income, preserve capital, and maintain liquidity under normal conditions. The offerings are available to institutions and accredited or professional investors.
Olivier Dang, KAIO’s chief operating officer, said the company is delivering access to leading fund strategies that range from money market products to macro digital asset funds.
“It’s the foundation for real-time, programmable, financial infrastructure built for the next era of capital markets,”
he stated.
KAIO also reported that more than $200 million in assets from global institutional funds—including BlackRock, Brevan Howard, Hamilton Lane, and Laser Digital—have already been tokenized on its platform using Hedera’s network.
HBAR forms bullish pennant, 108 percent measured move points to 0.527, August 15, 2025
The Hedera to United States dollar four hour chart on Coinbase, created on August 15, 2025 at 13:11 Coordinated Universal Time, shows a bullish pennant, which is a continuation pattern where a strong upward move pauses inside converging trendlines and often resumes in the direction of the prior advance.
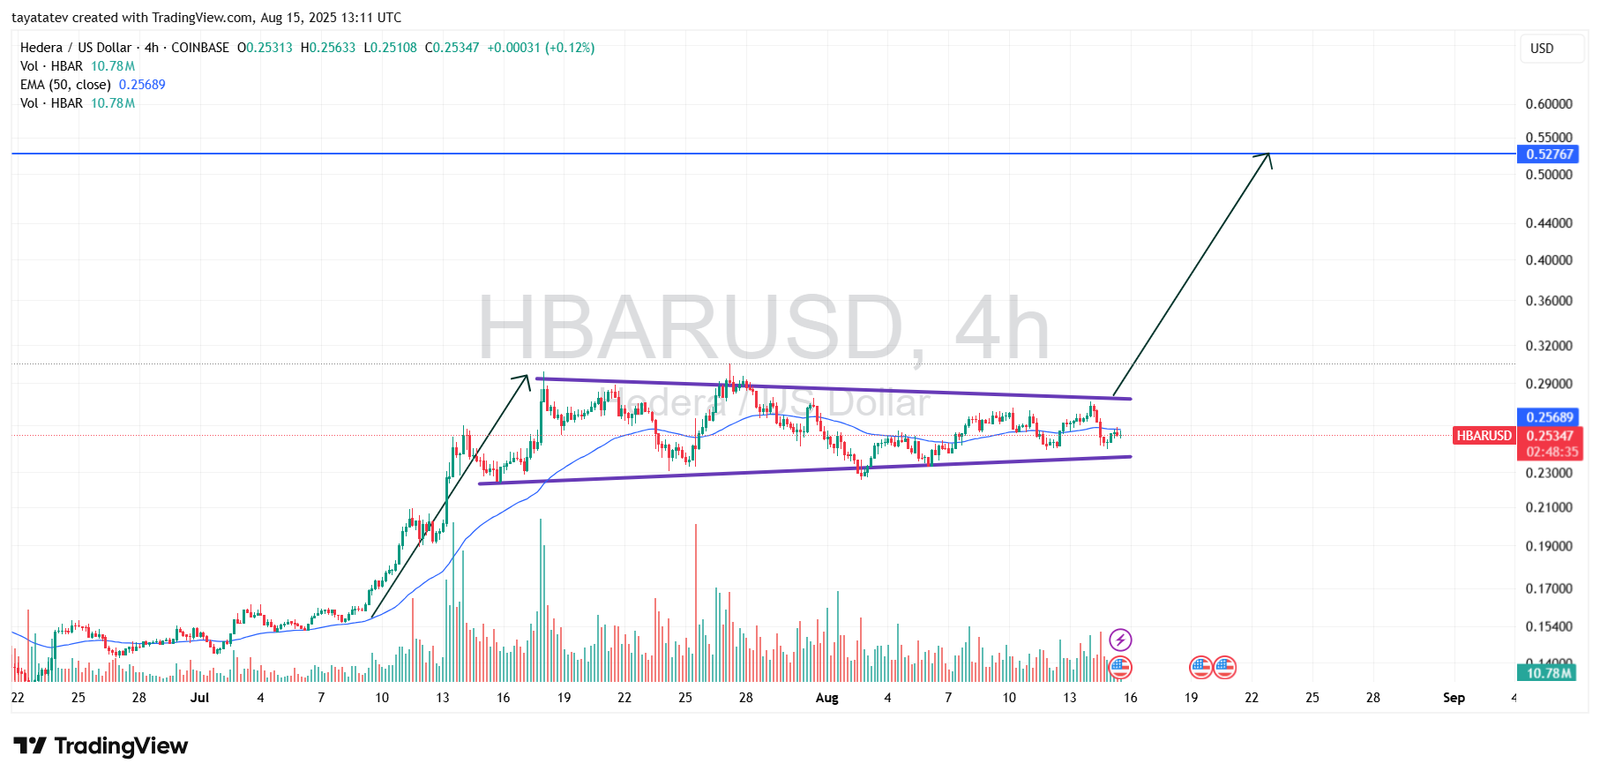
The price consolidates inside a narrowing band that connects lower highs and higher lows, while volume cools, and the structure builds energy for a potential breakout. The current consolidation follows the sharp July advance that formed the pole of the pennant, therefore the standard measured move projects an upside equal to that pole once resistance breaks. Using the chart’s current price near 0.253 and applying a one hundred eight percent measured extension gives a target around 0.527, which aligns with the blue horizontal reference drawn on the chart.
Meanwhile the upper trendline of the pennant sits just below 0.290, so a decisive four hour close above that boundary, ideally with expanding volume, would confirm continuation toward the objective. Additionally the 50 period exponential moving average, shown near 0.25689, acts as nearby dynamic resistance after a brief dip below it, and a sustained reclaim would strengthen the bullish case. However failure to hold the rising lower boundary, which tracks the mid 0.23 area on the graphic, would weaken the setup and defer the projection. Therefore the pattern signals that, if confirmed by a breakout above pennant resistance with momentum, Hedera may travel the measured distance toward approximately 0.527 from the current base.
HBAR MACD Analysis — August 15, 2025
The Hedera to United States dollar HBAR/USD moving average convergence divergence (MACD) chart, created on August 15, 2025 at 13:23 Coordinated Universal Time, shows the MACD line in blue at -0.00117 and the signal line in orange at -0.00002, with the histogram slightly in negative territory.
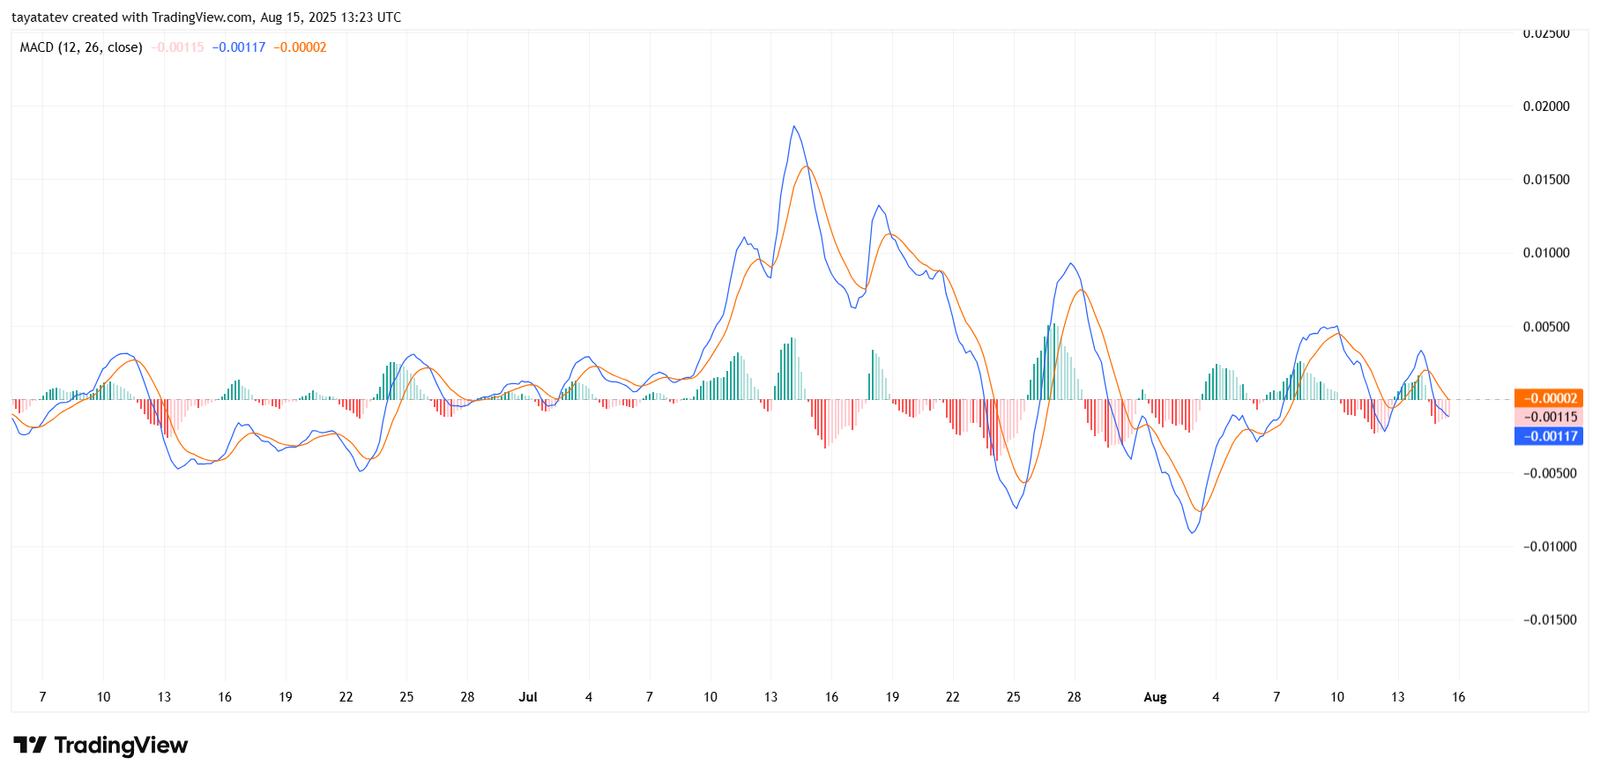
This position indicates a minor bearish crossover, where the MACD line has moved just below the signal line, suggesting short-term momentum has shifted against the bulls. Over the past month, the indicator has oscillated frequently between positive and negative territory, reflecting alternating waves of buying and selling pressure rather than a sustained trend.
The histogram bars, which represent the distance between the MACD and the signal line, have contracted sharply compared to early August, indicating reduced momentum. If the MACD line turns back above the signal line while the histogram shifts positive, it would signal renewed bullish momentum and could align with a breakout scenario visible on the price chart. Conversely, if the current crossover deepens with wider negative histogram bars, it would suggest that the bullish pennant setup is losing short-term strength before any attempt to push toward the 0.527 target.