
Sonnet BioTherapeutics, a biotech firm listed on Nasdaq, has announced a business combination with Rorschach, a newly formed entity, to establish a digital asset treasury focused on the Hyperliquid (HYPE) token.
The company disclosed the agreement on Monday, confirming the launch of Hyperliquid Strategies Inc. as part of the initiative. Upon closing, the new entity is expected to control 12.6 million HYPE tokens along with $305 million in cash reserves.
The funds will be used to increase the HYPE token holdings over time, signaling a strategic pivot into digital asset management alongside Sonnet’s core biotech operations.
HYPEUSDT Forms Ascending Channel, Chart Points to 161% Upside Potential
On July 17, 2025, a technical chart of Hyperliquid HYPE/ USDT on the KuCoin exchange showed the formation of an ascending channel pattern. The structure appears after a sustained upward move starting in April, with the price now trading at $45.97.
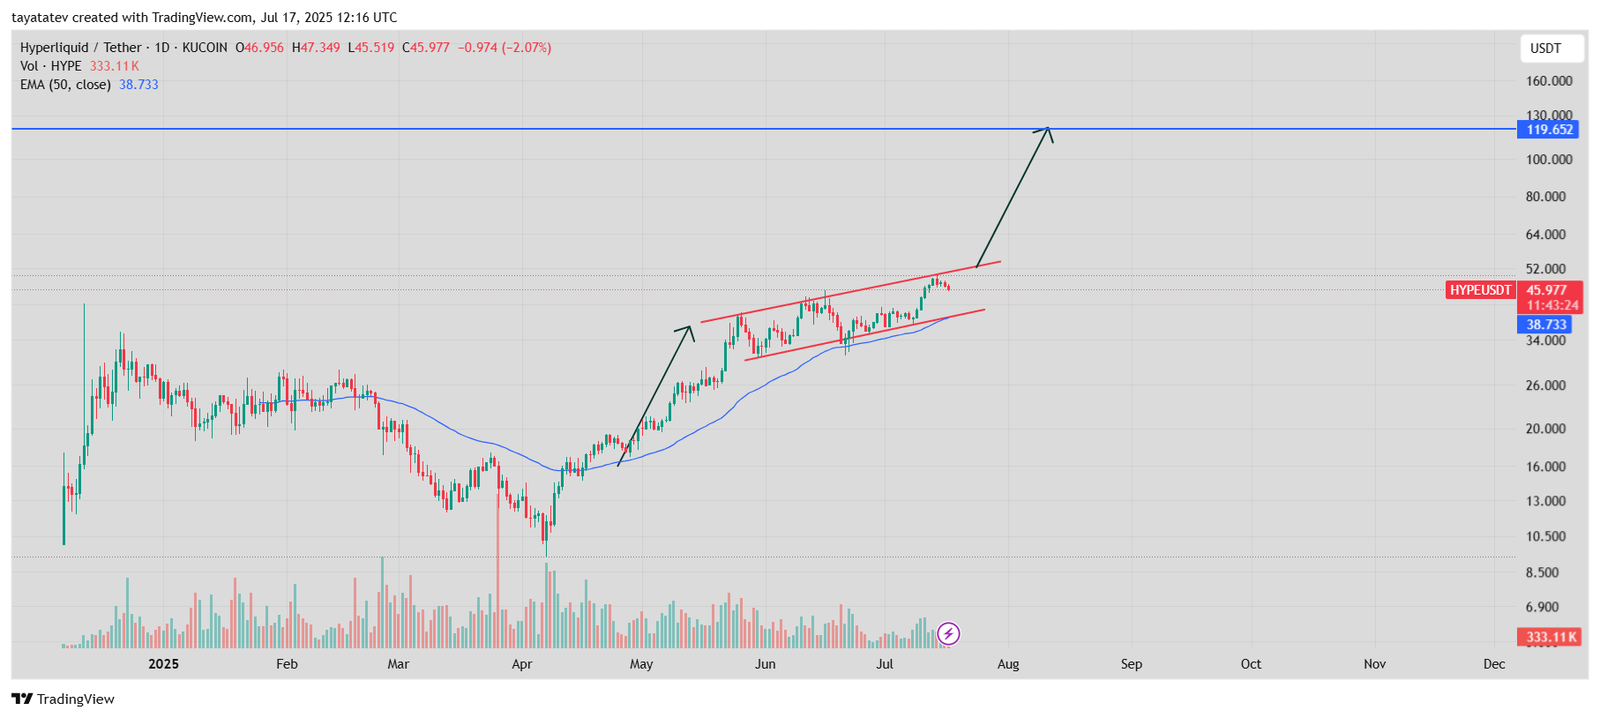
An ascending channel is a bullish continuation pattern where price moves between two upward-sloping parallel trendlines. The lower trendline acts as support while the upper one serves as resistance. This setup typically indicates that buyers continue to dominate, pushing the price gradually higher.
The chart reveals that the price has respected both trendlines over the past two months. The price bounced off the lower boundary multiple times and recently touched the upper boundary, showing the pattern is intact. The 50-day exponential moving average at $38.73 also confirms support is holding as the price trades above it.
If the pattern confirms and breaks upward, the projected move aligns with a measured target near $119.65. That would mark a 161% increase from the current price. The upward arrow in the chart marks this projected move, using the height of the channel to calculate the potential breakout range. The pattern’s slope and rising volume support the bullish continuation scenario.
HYPEUSDT MACD Shows Bullish Crossover, Momentum Strengthens
Meanwhile, the Moving Average Convergence Divergence (MACD) indicator for the HYPEUSDT trading pair on KuCoin confirmed a bullish crossover. The MACD line (2.694, blue) has moved above the signal line (2.235, orange), while the histogram printed a positive value of 0.460, showing rising momentum.
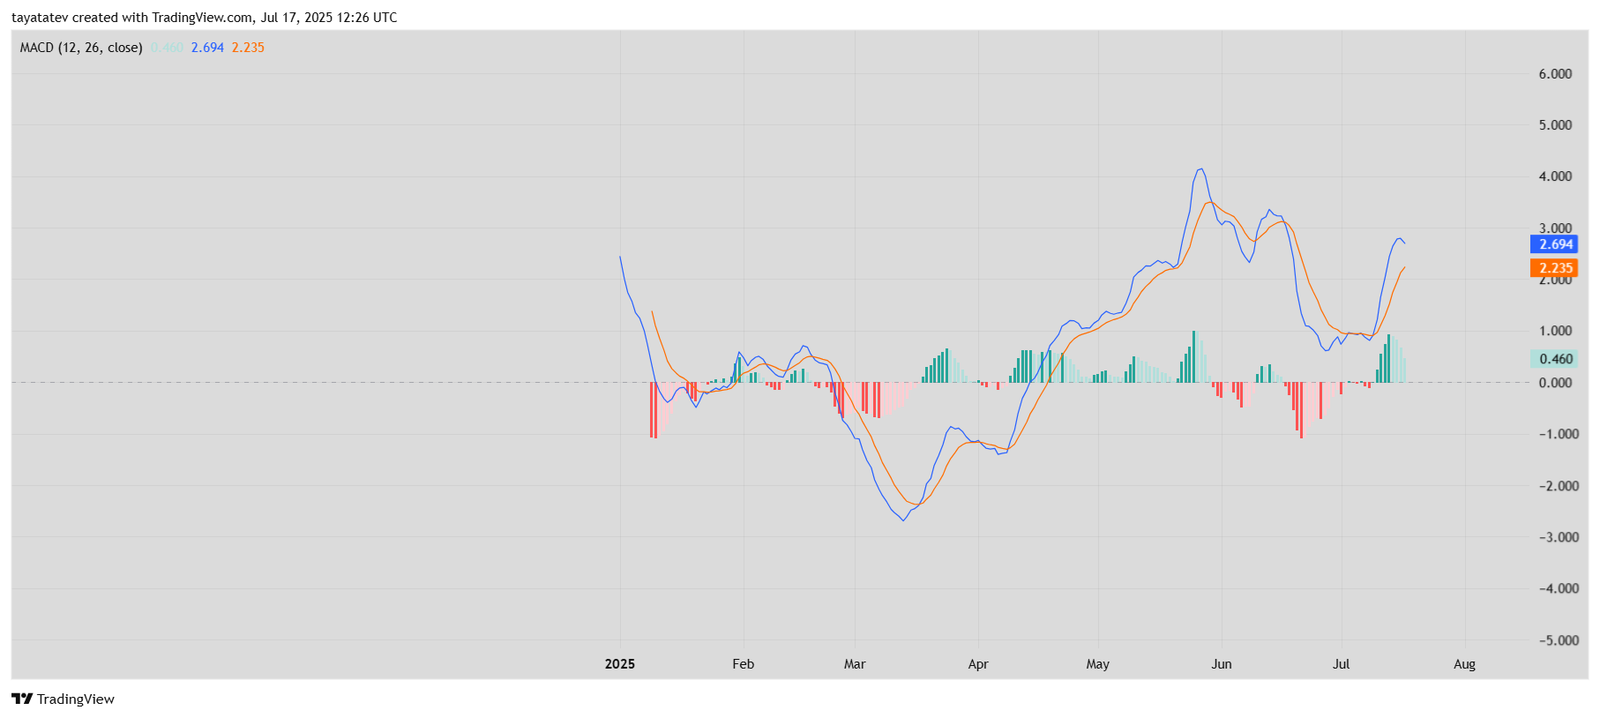
The MACD is a momentum indicator that tracks the difference between the 12-period and 26-period exponential moving averages. A bullish crossover—where the MACD line crosses above the signal line—typically indicates a shift toward buying pressure and potential price appreciation.
The histogram bars turning green and rising confirm strengthening upward momentum. This shift comes after a brief period of consolidation, aligning with recent price action within an ascending channel. The latest histogram bars also signal growing divergence between the MACD and signal lines, reinforcing the bullish trend.
The current structure suggests that momentum may continue to build if no breakdown occurs. This reading supports the breakout projection seen in the earlier ascending channel analysis.
HYPEUSDT RSI Shows Strength but Remains Below Overbought Zone
On July 17, 2025, the Relative Strength Index (RSI) for HYPEUSDT stood at 61.81, just below the overbought threshold of 70. The indicator, based on a 14-day average, suggests that momentum remains in favor of buyers without entering extreme territory.
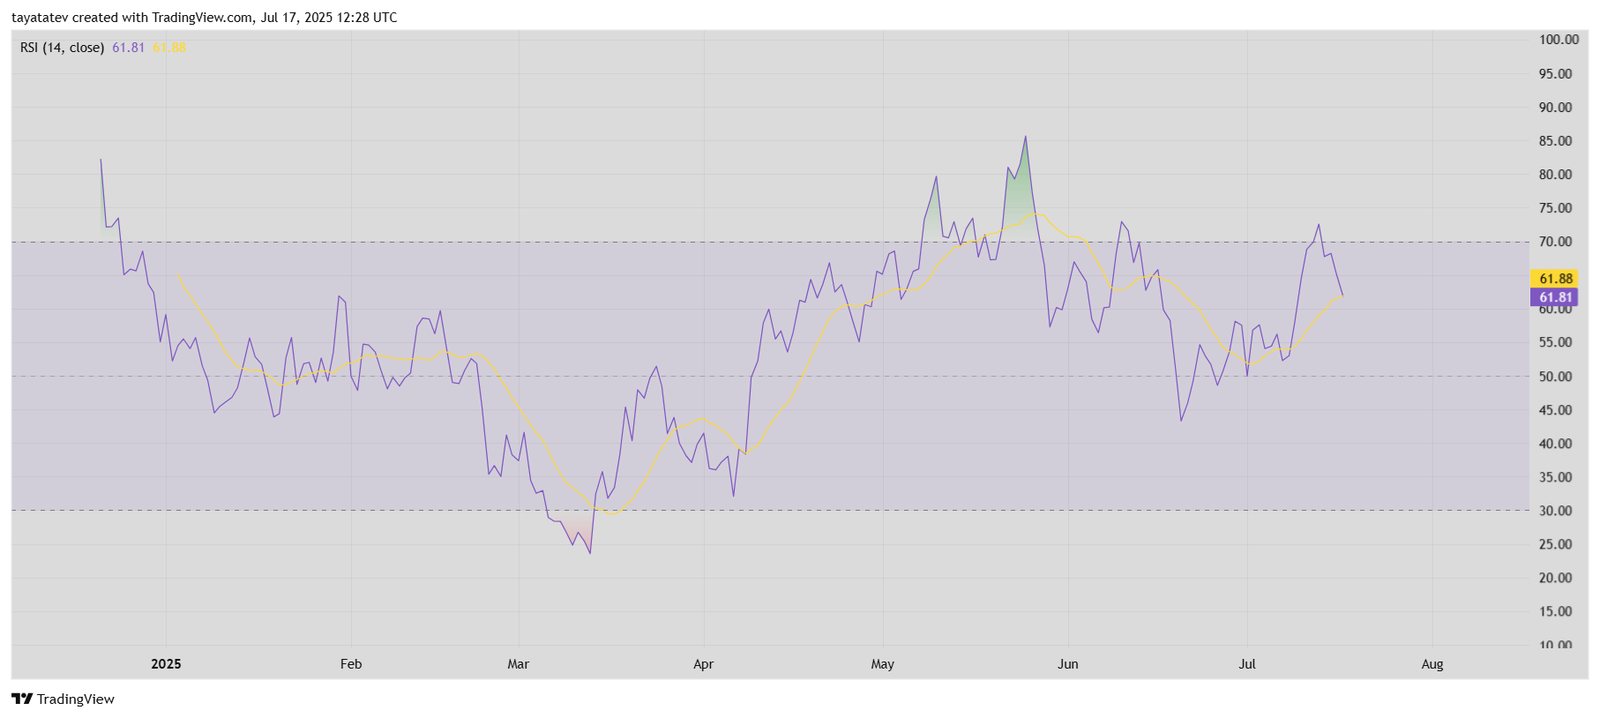
The RSI is a momentum oscillator that measures the speed and change of price movements on a scale from 0 to 100. Readings above 70 typically signal overbought conditions, while levels under 30 indicate oversold territory. The current reading above 60 confirms a strong trend but leaves room for more upside.
The RSI line has been climbing since late June, and the yellow signal line at 61.88 now closely trails the main RSI curve. The near convergence of both lines shows consistent momentum without signs of exhaustion. This supports the continuation of the bullish trend noted in both the ascending channel and MACD charts.
As of now, the RSI chart confirms that the upward move in HYPE is backed by healthy momentum. The price has room to grow before reaching an overbought state, giving technical support to a potential breakout.
HYPEUSDT Price Holds Above Ichimoku Cloud, Strong Bullish Signal Active
As of July 17, 2025, the HYPEUSDT chart on KuCoin displays a bullish formation within the Ichimoku Cloud indicator. The price remains well above the cloud span, confirming a continued uptrend. The latest label on the chart reads “Strong Bullish,” following earlier “Weak Bullish” and “Weak Bearish” phases, showing strengthening trend direction.
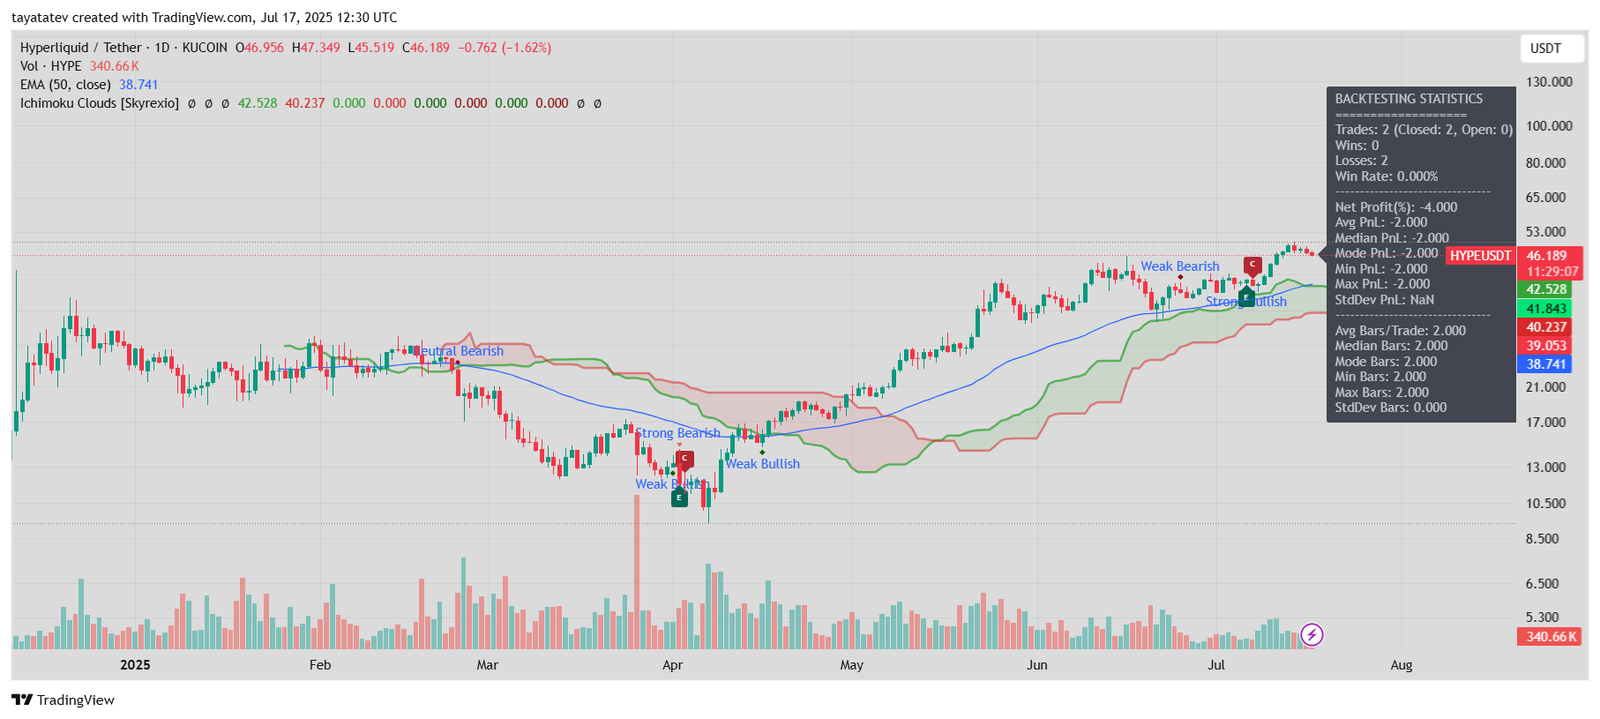
The Ichimoku Cloud, or Ichimoku Kinko Hyo, is a trend-following system that uses five key metrics to define support, resistance, and market direction. When price moves above the cloud, sentiment is generally bullish. A thick green cloud below the price signals strong underlying support, while a red cloud would indicate bearish conditions.
The current structure shows the green cloud trailing below the price with increasing separation, indicating rising support levels. Past cloud rejections now act as confirmed support zones. The flat cloud top from May and June served as a launchpad for the recent rally.
The trend labels—automated signals such as “Strong Bullish”—have accurately aligned with price direction since April. No bearish crossover is visible in the present setup, suggesting that bulls remain in control of momentum.
HYPEUSDT DMI Signals Strengthening Bullish Pressure
The Directional Movement Index (DMI) chart for HYPEUSDT displayed a rising blue +DI line at 29.91, crossing above the red -DI line at 23.47. This crossover confirms a strengthening bullish trend after weeks of indecisive movement. The orange Average Directional Index (ADX), which measures trend strength, stands at 14.59—still weak, but gradually rising.
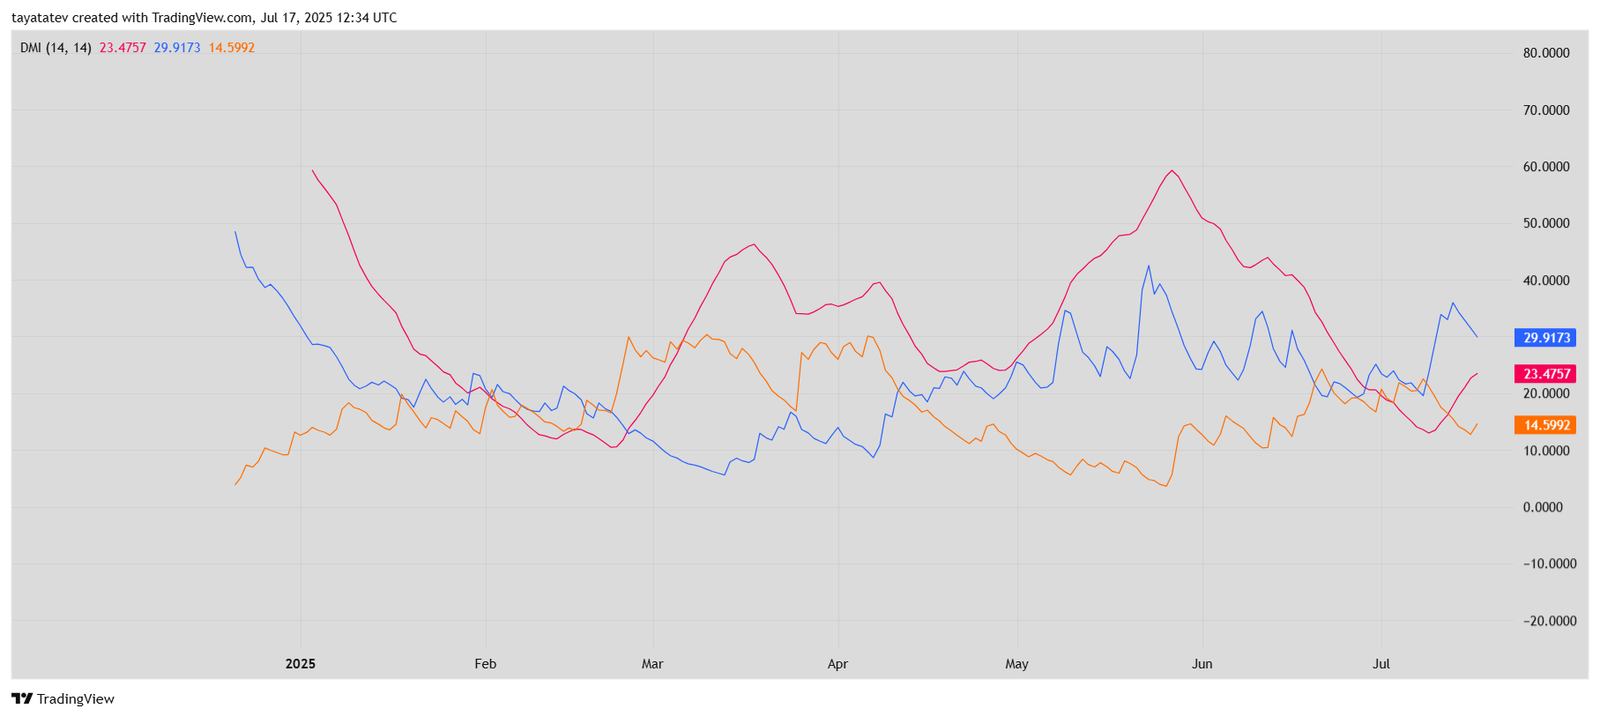
The DMI is a trend indicator that shows whether bulls or bears are in control. When the blue +DI line stays above the red -DI line, buyers dominate the market. The gap between the lines helps gauge how strong that control is. Meanwhile, the ADX value indicates if the trend is gaining momentum. A rising ADX above 20 is typically seen as a sign that the trend is becoming meaningful.
This latest crossover suggests bulls are regaining control. If the ADX continues to rise above 20, the current price move may extend, aligning with other bullish indicators like the ascending channel, MACD crossover, and positive RSI.
