
On June 1, 2025, the one-hour chart for HYPEHUSD (Hyperliquid to U.S. Dollar) shows the formation of a bearish pennant pattern.
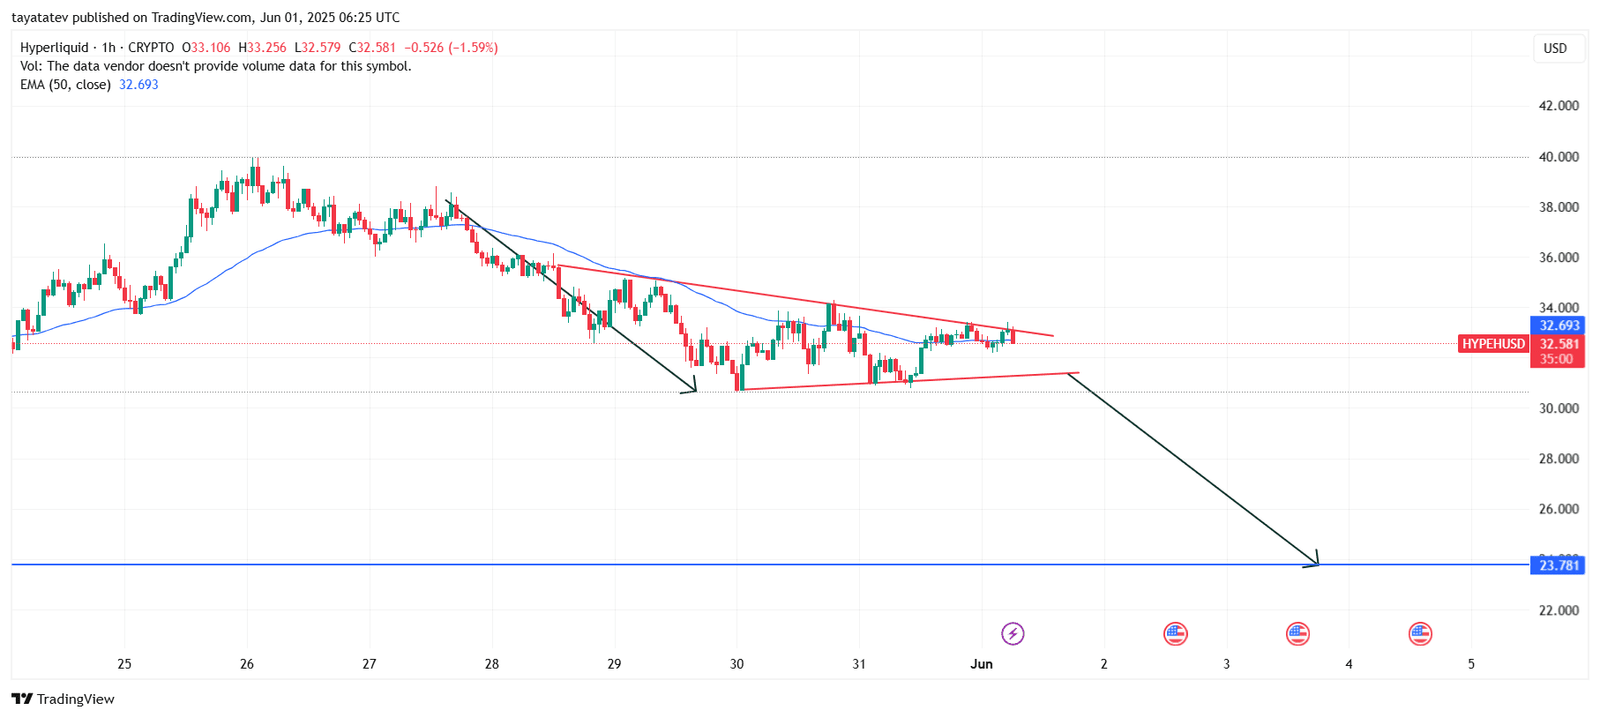
A bearish pennant forms after a sharp downward move called a flagpole. In this chart, the initial drop started on May 27 and ended around May 29. After that, the price consolidated between converging trendlines, forming the pennant shape. The 50-period Exponential Moving Average (EMA), marked in blue, now hovers near $32.693, just above the current price of $32.581.
A pennant pattern typically appears during a pause in the trend. The pattern has two key parts: the flagpole (the steep drop) and the pennant (a small triangle created by converging trendlines). When the price breaks below the lower trendline, it confirms the pattern and suggests further downside.
If this bearish pennant confirms, the price may fall by the same length as the flagpole. Based on the current price of $32.581, a 27% drop would send the asset down to around $23.78, which is also marked on the chart as a possible support level.
Currently, the price is struggling to break above the upper red trendline. It remains below the 50-period EMA, signaling weak momentum. If sellers push it below the lower red boundary, this will likely trigger the bearish breakdown.
The price structure aligns with bearish continuation signals. Until HYPEHUSD moves back above the pennant’s upper trendline and the EMA, the pattern stays valid. If breakdown pressure continues, the projected target of $23.78 remains active.
HYPEHUSD RSI Shows Neutral Momentum Before Possible Breakdown
On June 1, 2025, the Relative Strength Index (RSI) chart for HYPEHUSD (Hyperliquid to U.S. Dollar) shows neutral conditions. The RSI (14, close) stands at 49.54, while the 14-period Simple Moving Average of RSI is at 53.22. Both values remain within the mid-range, between 30 and 70, suggesting neither overbought nor oversold pressure dominates.
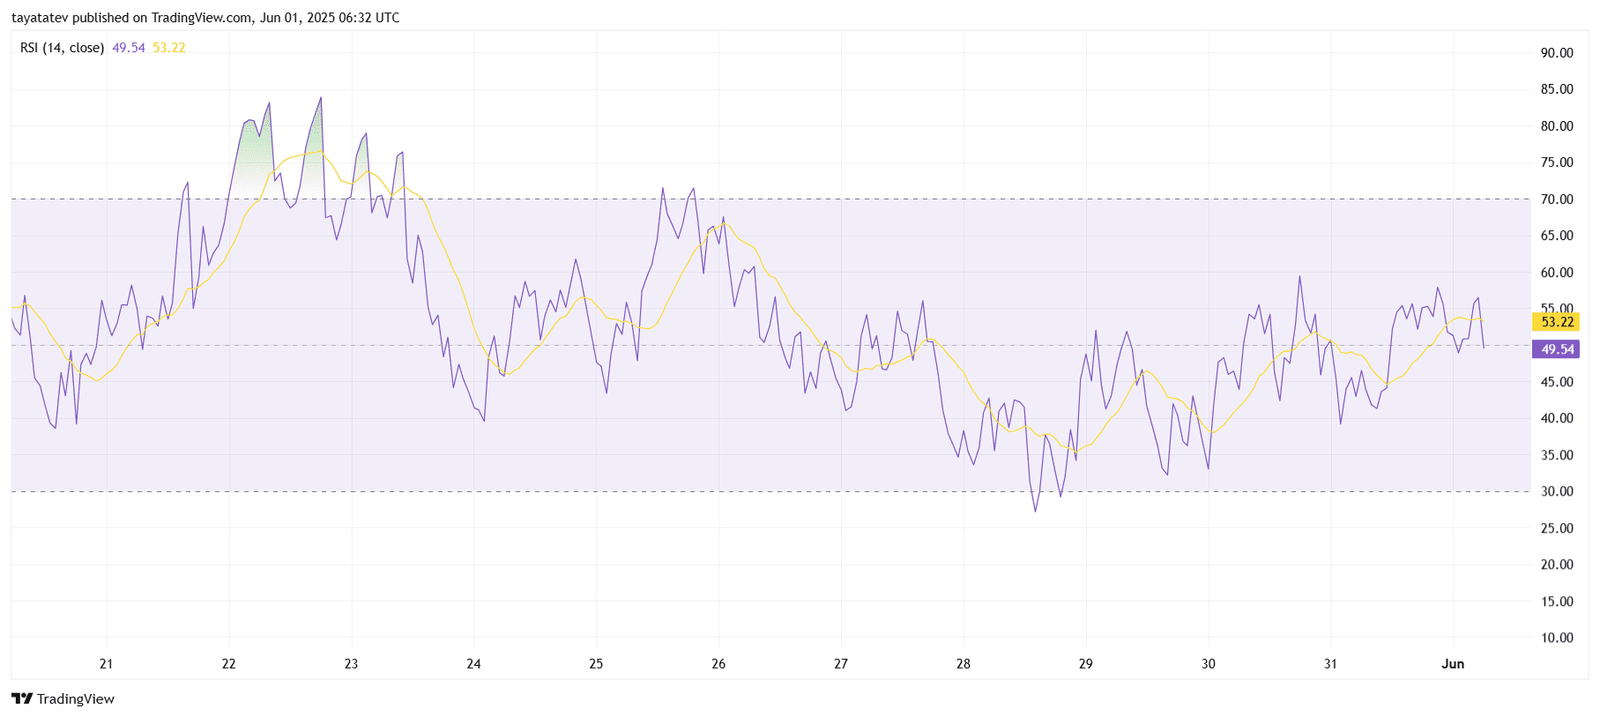
The RSI has moved below its signal line (yellow), which signals weakening momentum. As the value dropped under the moving average, bearish pressure may build if the current trend continues. RSI readings between 40 and 50 often act as early warnings during consolidation before a breakout or breakdown.
In previous sessions, RSI briefly crossed above 70, showing temporary overbought conditions around May 22. However, it failed to hold above that zone. The chart has since formed a lower high, confirming a downtrend in momentum. Moreover, RSI stayed mostly under the midline since May 26, matching the bearish pennant formation seen in the main price chart.
Unless RSI reverses and climbs back above 55, the indicator suggests limited upside strength. If the price breaks below the pennant’s lower boundary, RSI may fall below 40, confirming bearish continuation.
HYPEHUSD BBTrend Indicator Signals Weakening Momentum
The BBTrend (Bollinger Band Trend) indicator for HYPEHUSD (Hyperliquid to U.S. Dollar) printed a value of 29.798. The BBTrend uses periods of 20, 50, and 2 to track the strength and direction of trends. It shifted green during mid-April and continued rising into May, signaling a bullish trend.

However, after peaking near 45 in late May, the bars started flattening. The recent sideways move indicates fading bullish strength. While the value remains in positive territory, the slope suggests slowing momentum.
Earlier in March and April, the BBTrend stayed deeply negative—reaching below –75—which confirmed a strong bearish phase. That trend reversed in late April as green bars appeared, showing a transition from bearish to bullish territory.
Now, despite staying above zero, the green bars show little expansion. If this indicator turns red again in the coming sessions, it would confirm bearish control and align with the bearish pennant pattern on the price chart.
The current BBTrend signal shows indecision. Unless the value climbs above its previous highs, buyers risk losing strength, and the trend could flip back to negative.
HYPEHUSD Holds Ichimoku Cloud Support But Faces Resistance
Meanwhile, he daily chart for HYPEHUSD (Hyperliquid to U.S. Dollar) shows mixed signals on the Ichimoku Cloud indicator.
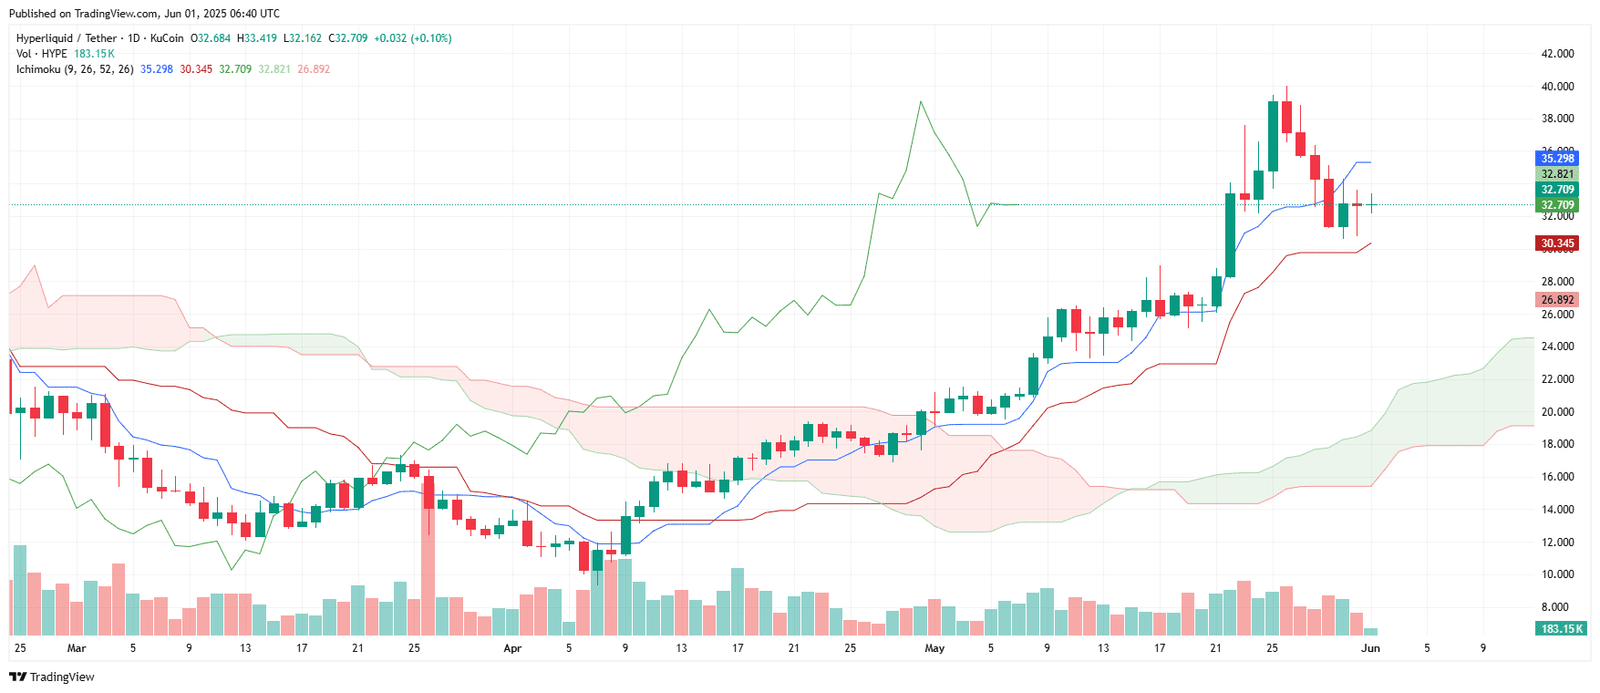
The price currently trades at $32.709, sitting directly on the Kijun-sen (Base Line), which also reads $32.709. The Tenkan-sen (Conversion Line) is slightly higher at $32.821, showing mild short-term resistance. Above both lines, the Senkou Span A stands at $30.345 and Senkou Span B at $26.892, forming the green Ichimoku cloud below the current price. This suggests a bullish support zone remains intact.
However, the Chikou Span (Lagging Span) has started turning sideways, showing a potential momentum slowdown. At the same time, the price recently pulled back from a local high near $42. This retracement coincides with lower volume and a weak follow-through above the Tenkan-sen.
For now, HYPEHUSD holds inside the bullish structure, with the cloud providing support between $30.345 and $26.892. If the price closes below both the Kijun-sen and the cloud, the trend would shift bearish. Until that happens, the Ichimoku setup remains technically positive but fragile.
If bulls regain strength and push the price above the Tenkan-sen, short-term upside momentum could resume. Otherwise, a deeper pullback toward the top of the cloud remains possible.
HYPEHUSD Directional Movement Index Shows Declining Trend Strength
On June 1, 2025, the Directional Movement Index (DMI) for HYPEHUSD (Hyperliquid to U.S. Dollar) reflects weakening bullish pressure. The DMI indicator includes three key components:
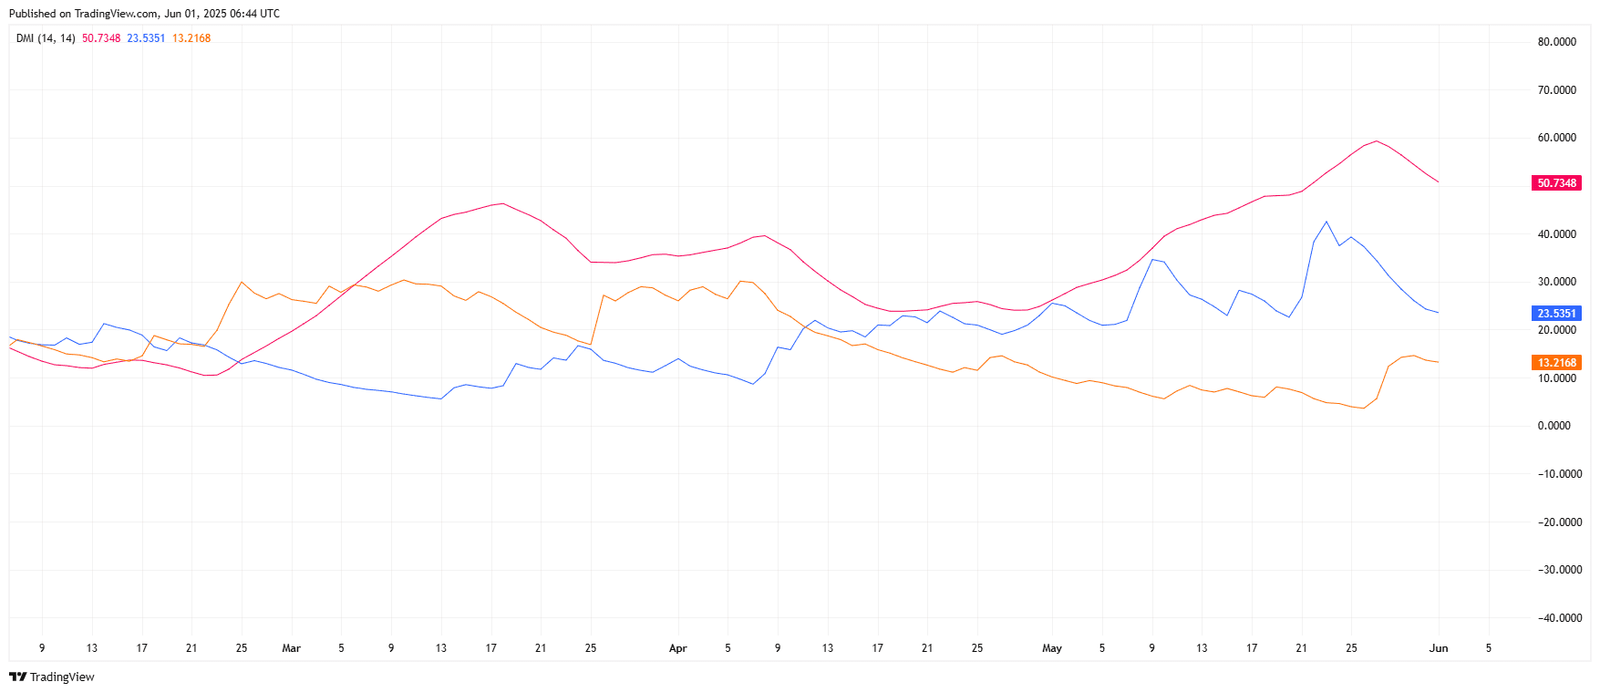
ADX (Average Directional Index) – shown in pink, stands at 50.7348
+DI (Positive Directional Indicator) – in blue, measures 23.5351
–DI (Negative Directional Indicator) – in orange, at 13.2168
The ADX value above 50 confirms a strong trend, but it has started to slope downward from recent highs. This signals that the trend, although still strong, is losing strength. Meanwhile, the +DI remains significantly higher than the –DI, showing that bulls still dominate, but with reduced momentum.
In late May, the +DI line peaked above 40, while the –DI stayed below 15. That gap indicated strong bullish control. Now, the spread between the two lines is narrowing. The ADX is also pulling back, which often suggests consolidation or an upcoming reversal.
If +DI continues falling and –DI begins rising, this would confirm a shift in control toward sellers. For now, the market remains in a bullish structure, but DMI signals that strength is fading. A bearish crossover between the two DI lines would support the bearish pennant scenario visible on the price chart.
