
As of June 16, 2025, Hyperliquid (HYPE/USD) has surged by approximately 82.36% since the beginning of the year. The price climbed from around $23.90 on January 1 to a recent high of $43.59, marking a gain of nearly $19.69 over 166 days. The price action shows strong upward momentum, especially after a mid-April breakout above the 50-day Exponential Moving Average. Since then, Hyperliquid has maintained a steady climb, breaking past previous resistance levels and nearing a new yearly peak.

Bullish Pennant Pattern Signals Potential Breakout
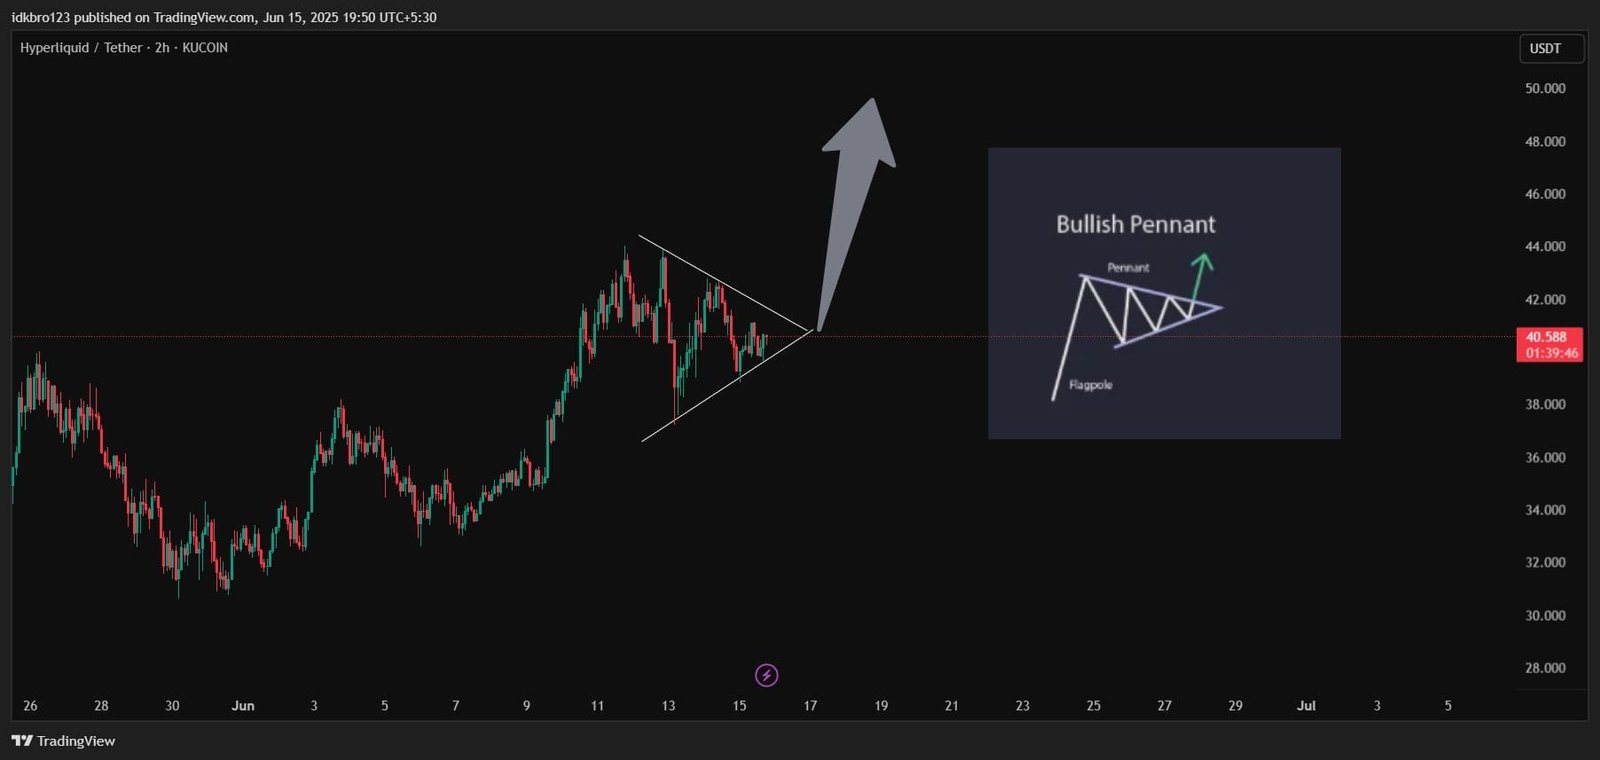
On June 15, 2025, X user @Obesepotato_hl (obese.potato.pip) shared a chart showing a bullish pennant forming on the HYPE/USDT pair. The pattern appeared after a sharp upward move and now shows tightening price action within converging trendlines. The price hovered near $40.59 at the time of the post.
The user captioned the post,
“Bullish pennant spotted on hype chart hype going $50 longing here with 100x.”
This suggests they expect a breakout continuation toward the $50 mark. The chart includes a textbook pennant diagram and an upward arrow projecting a bullish move.
The structure matches a classic bullish pennant. After the flagpole rally, price consolidated into a triangle with lower highs and higher lows. If a breakout above resistance follows with strong volume, it may trigger the next leg higher. The setup supports short-term bullish bias.
Hyperliquid Faces Elliott Wave Exhaustion Signal, Analyst Warns of Sharp Reversal
Menwhile, X user @Akali_Crypto shared a long-term chart of Hyperliquid (HYPE/USD), suggesting that the asset may be nearing the end of a complex Elliott Wave structure. The chart identifies a full W-X-Y-X-Z corrective wave, with HYPE trading around $42.14, just below a projected resistance zone between $45.05 and $51.15—the 161.8% Fibonacci extension.

The chart overlays a Bullish Shark harmonic pattern, signaling a possible retracement toward the $32–$36 zone before any new leg higher. However, a deeper correction to the $9.32 level is also mapped as a potential longer-term retracement target.
@Akali_Crypto commented,
“Hey @JamesWynnReal, Hype will be the LUNA of 2025! XOXO”
The post references Terra’s historic rise and fall, hinting at possible volatility ahead. While the price structure remains bullish short-term, the setup warns of exhaustion and a potential sharp correction if the $51 zone rejects further upside.
The bearish projection box indicates risk zones traders may monitor if HYPE fails to sustain above the wave peak.
Hyperliquid Surges 330%, Crosses $2B TVL, Nears All-Time High
Hyperliquid (HYPE) soared by 330% from its April low. The token’s market capitalization has reached $13 billion, while its fully diluted valuation climbed to $40.75 billion.
DeFi Llama data confirms that Hyperliquid’s layer-1 chain has surpassed $2.01 billion in total value locked (TVL), marking a 70% jump over the past 30 days. This rapid growth has made it the 11th largest blockchain network, overtaking Cardano, Hedera Hashgraph, and Near Protocol.
Currently, the main projects driving activity on Hyperliquid’s chain include Hyperliquid itself, along with Hyperlend, Felix, Morpho, and Hyperbeat.
At the same time, Hyperliquid has expanded its influence in the stablecoin sector. The chain now hosts $3.7 billion worth of stablecoins, up from $2 billion in January. This volume places it as the sixth largest stablecoin network globally—behind only Ethereum, Tron, Solana, BNB Chain, and Base.
Hyperliquid’s perpetual exchange also continues to lead the market. In the past 24 hours, it processed over $4.43 billion in trading volume—outpacing all other top-ten platforms combined. On a monthly basis, its volume has surged to $242 billion.
Investor interest in staking HYPEtokens remains strong. The staking market cap jumped by 16% in just one week, reaching $17.1 billion, signaling growing confidence in the project’s ecosystem.
Hyperliquid RSI Approaches Overbought Zone in June
As of June 16, 2025, Hyperliquid’s Relative Strength Index (RSI 14) stands at 68.97, just below the overbought threshold of 70. The RSI has remained above the 50 level since early April, indicating persistent bullish momentum throughout Q2.
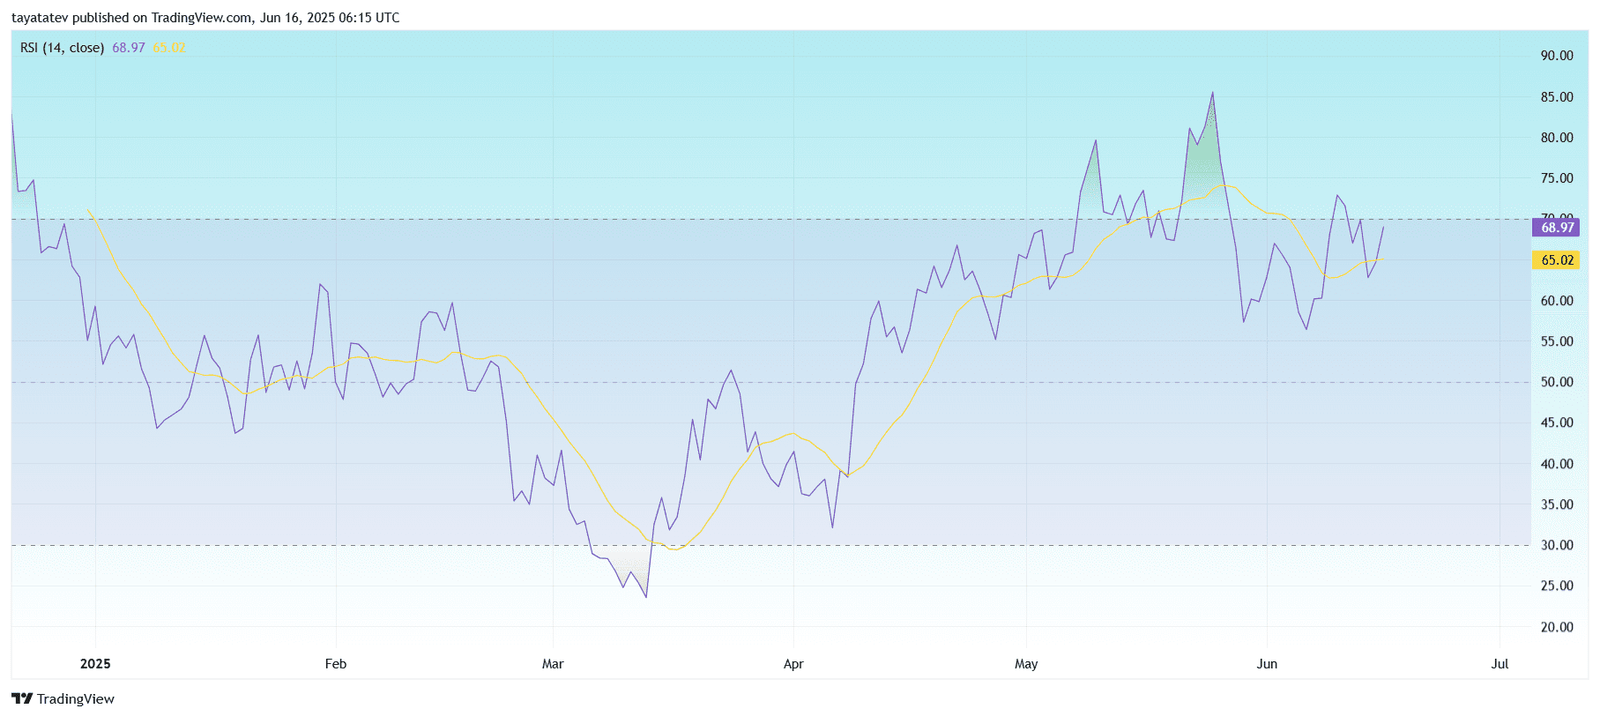
The yellow line, a moving average of the RSI (currently at 65.02), remains below the RSI curve. This alignment signals continued strength and suggests bulls still dominate the market. Each dip since April has formed a higher low, reinforcing the uptrend.
The RSI recently bounced off the 60 support level and is climbing again. If it crosses 70, the asset may enter overbought territory. However, in strong uptrends, RSI can stay overbought for extended periods before any correction begins.
Hyperliquid continues to show strength based on RSI and trend-following metrics.
Hyperliquid SMI Maintains Bullish Momentum in June
As of June 16, the Stochastic Momentum Index (SMI) shows the main line at 60.95, above the signal line at 56.47. This crossover indicates bullish momentum, as the faster-moving SMI line stays above the slower signal line.
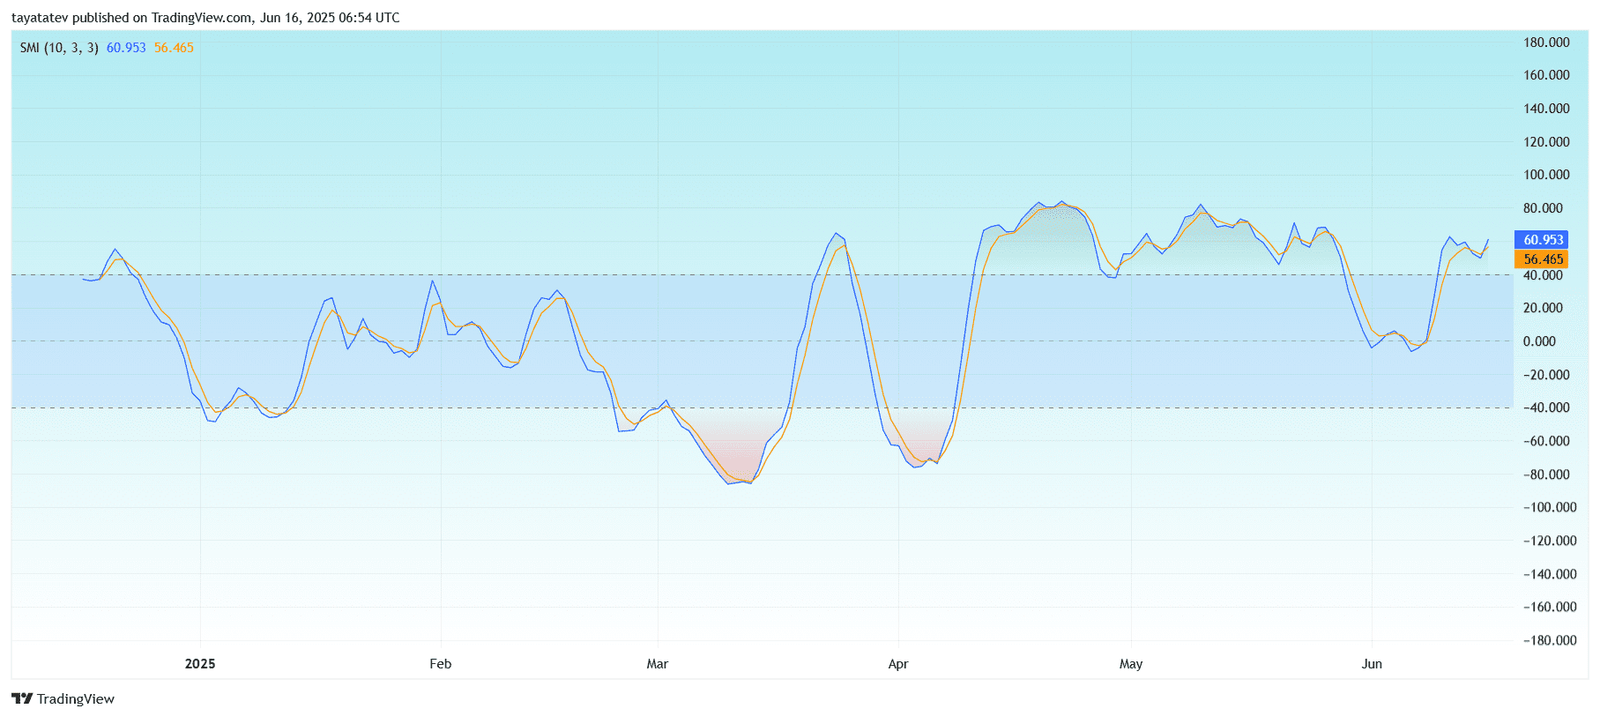
Both lines remain above the neutral 0 level, reinforcing a positive trend. The previous SMI cross occurred below the zero mark in early June, and since then, the index climbed steadily. Sustaining this trajectory suggests increasing buying pressure.
Since April, the SMI has formed a pattern of higher lows, showing recovery after each dip. The latest upward push confirms that momentum favors bulls. If the SMI maintains current levels or climbs further, it could support continued price strength in the short term.
Hyperliquid MACD Holds Bullish Crossover Despite Weak Momentum
Meanwhile, Hyperliquid’s Moving Average Convergence Divergence (MACD) indicator remains in bullish territory. The MACD line (blue) is at 3.459, still above the signal line (orange) at 3.170. This alignment indicates sustained positive momentum, though the gap between the lines has narrowed in recent days.
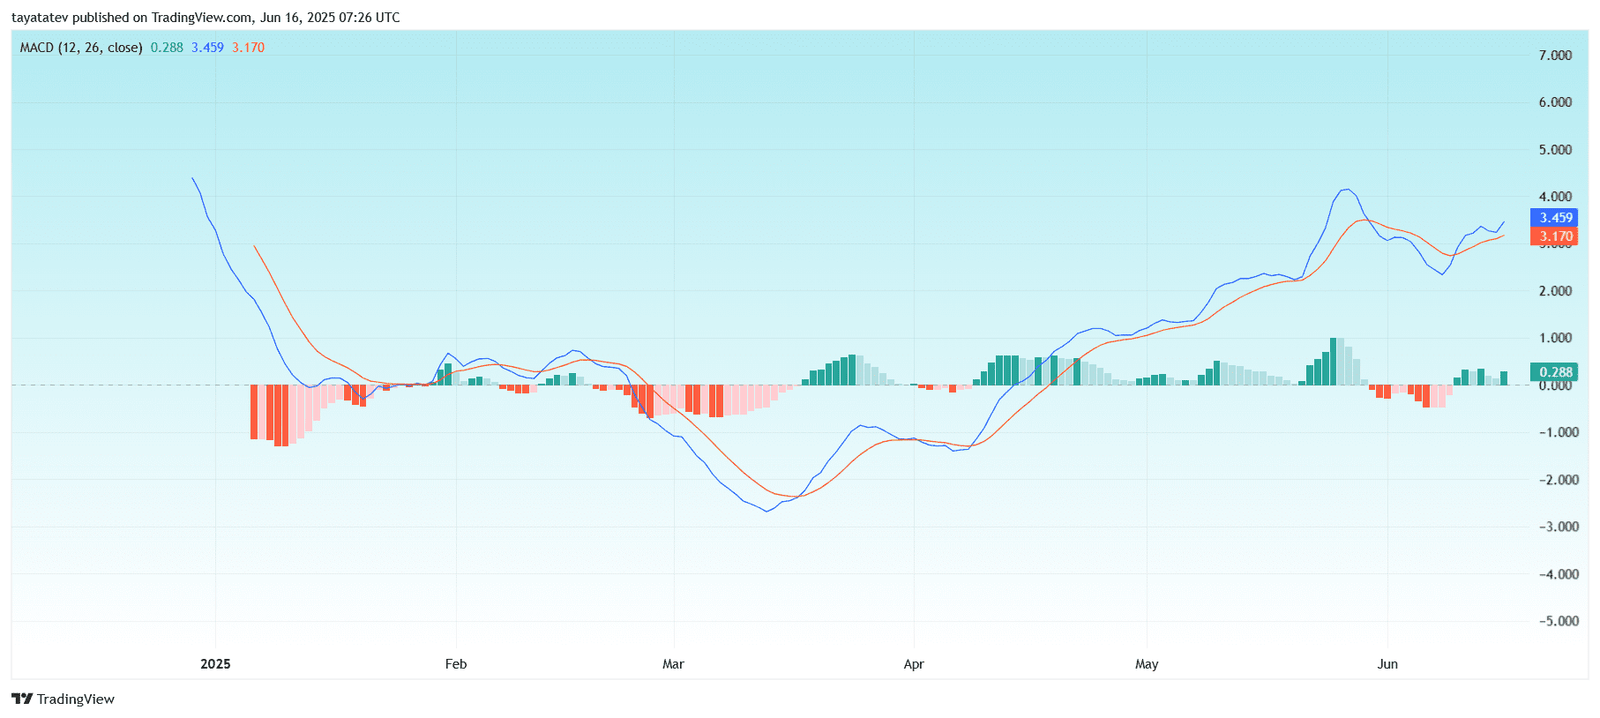
The MACD histogram shows a small positive reading of 0.288, suggesting momentum is still bullish but fading. After a strong run in May, the histogram bars have become shorter, showing reduced upside strength. The histogram nearly flattened in early June, before slightly rising again.
Since late March, the MACD trend has supported the broader uptrend, with consistent higher highs on the histogram. However, the recent narrowing spread between the MACD and signal lines, along with weakening histogram bars, signals caution. If the MACD crosses below the signal line, it could indicate the start of a correction phase. For now, the structure remains bullish but fragile.
