
Decentralized exchange Hyperliquid recorded over $1.57 trillion in onchain perpetual futures trading volume over the past year, according to data compiled by Sealaunch on Dune Analytics.
The platform saw a surge in activity between November and December 2024, coinciding with its $1.2 billion HYPE token airdrop. During that period, Hyperliquid’s trading volume doubled from $75 billion to $150 billion.
In May alone, the platform registered $248 billion in perpetual futures volume. For June, the figure stands at $208 billion so far. In comparison, other onchain perpetual exchanges collectively processed around $140 billion this month, highlighting Hyperliquid’s lead in the sector.
Over the past month, Hyperliquid generated $56 million in fees and revenue, pushing its total cumulative revenue to $310 million.
“Hyperliquid offers sub-second finality and handles over 100,000 orders per second, powering a fully onchain order book that delivers unmatched speed and transparency,”
said Min Jung, a research analyst at Presto Research.
Besides trading, the platform has expanded its infrastructure. Earlier this year, it launched HyperEVM, an Ethereum-compatible environment for developers to build and deploy smart contracts and dapps. HyperEVM runs on HyperCore, the base software behind Hyperliquid’s Layer 1 blockchain.
“Combined with its community-focused buyback program, robust HyperEVM ecosystem, and clear on-chain auditability, Hyperliquid has proven it can match the depth and resilience of top centralized venues, while staying radically transparent,”
Min added.
Hyperliquid Forms Bullish Pennant With 34% Upside Potential
On June 30, 2025, the HYPE/USDT daily chart formed a bullish pennant pattern. This technical structure typically signals a continuation of the previous uptrend after a brief consolidation. A bullish pennant appears when the price rallies sharply, then moves sideways in a converging triangle before potentially breaking out higher.
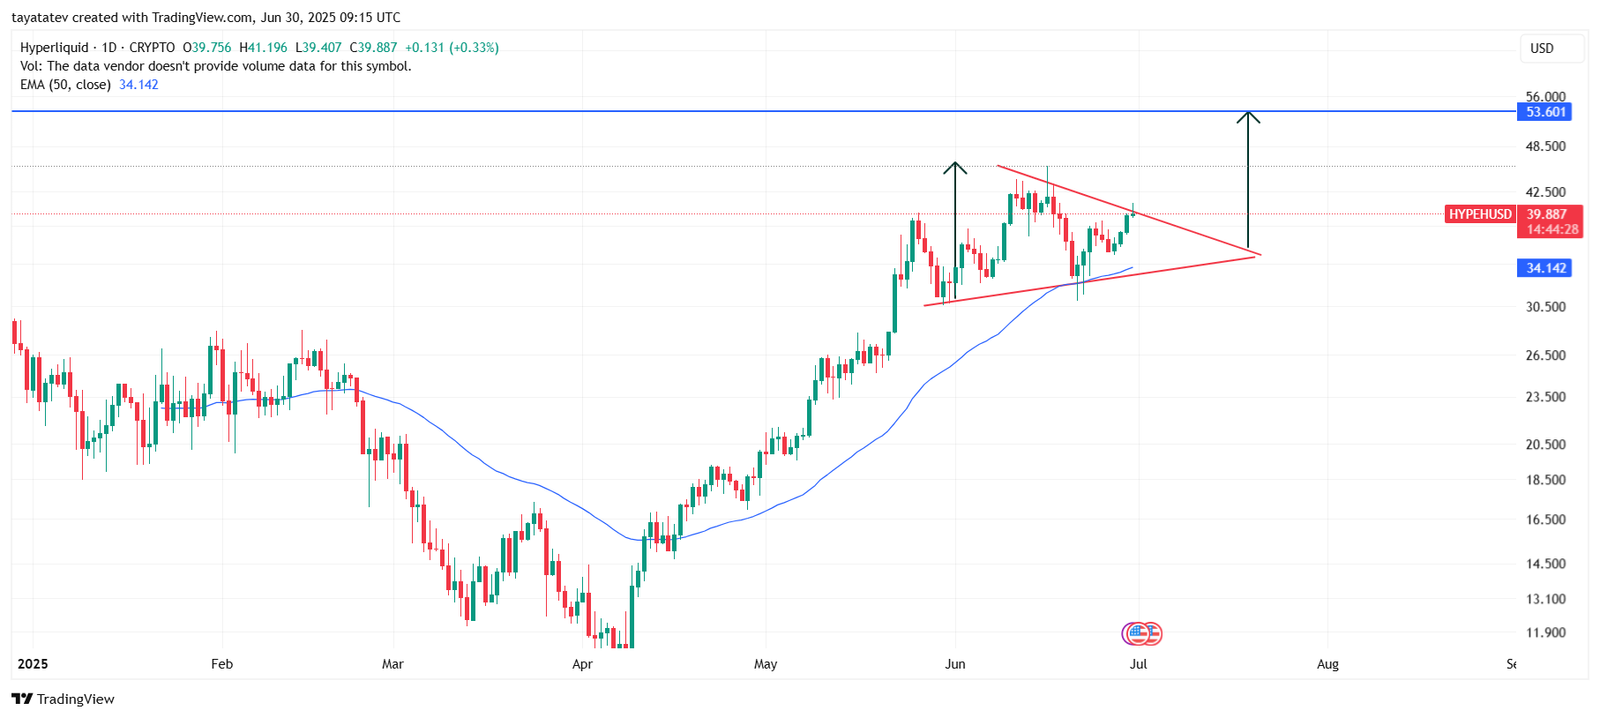
Currently, the Hyperliquid token (HYPE) trades at $39.88. The chart shows the pennant formed after a strong move from around $28 to $41. That $13 move forms the “pole” of the pennant. If the price confirms the breakout above the upper trendline of the triangle, the expected upward move could mirror the size of that pole.
Therefore, the projected target after a successful breakout is around $53.60 — a 34% increase from the current price. This target aligns with the height of the initial rally added to the breakout level.
The 50-day Exponential Moving Average (EMA) currently sits at $34.14 and supports the bullish structure by holding under the pennant’s base. If HYPE stays above this moving average and breaks out with strong momentum, the pennant setup may validate.
Further upside confirmation will require a daily close above the upper resistance trendline of the pennant, ideally with increased trading volume. A move toward the $53.60 level would then be technically justified based on the pennant’s measured move.
HYPE RSI Rebounds Toward Bullish Zone as Momentum Builds
On June 30, 2025, the Relative Strength Index (RSI) for HYPE/USDT climbed to 58.47, up from a recent low near 45 earlier in June. The RSI, a momentum indicator that measures the speed and change of price movements, is trending upward and nearing the bullish territory above 60.
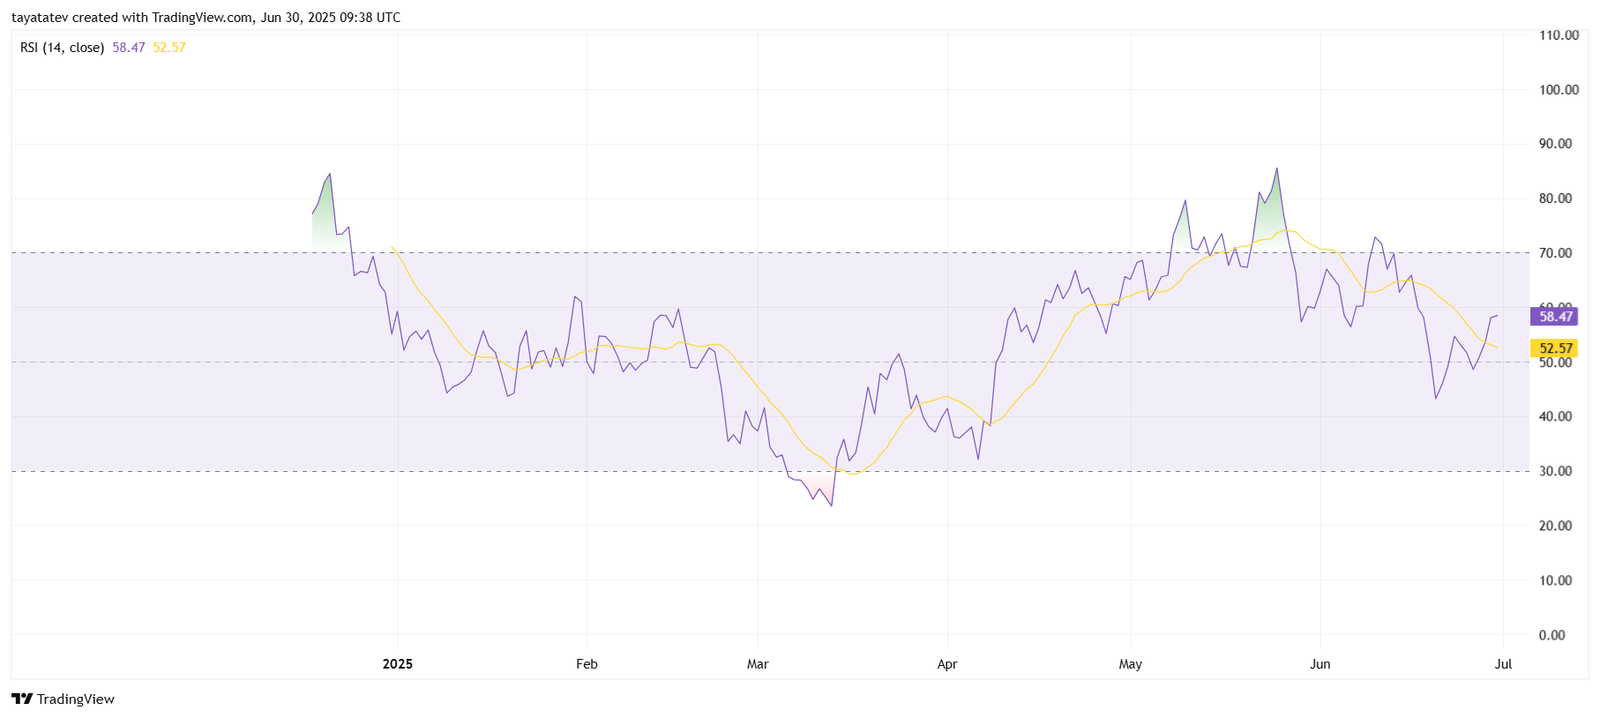
The 14-day RSI line has also crossed back above its moving average, which currently stands at 52.57. This crossover is often interpreted as a shift toward upward momentum.
Typically, RSI values above 70 suggest overbought conditions, while levels below 30 indicate oversold conditions. An RSI between 50 and 70 often reflects strengthening bullish sentiment. If the RSI continues to rise and crosses above 60, it could confirm growing buying interest.
The latest move in RSI supports the bullish pennant pattern spotted on the daily price chart. Together, these signals suggest the price may be preparing for a breakout if momentum sustains.
