
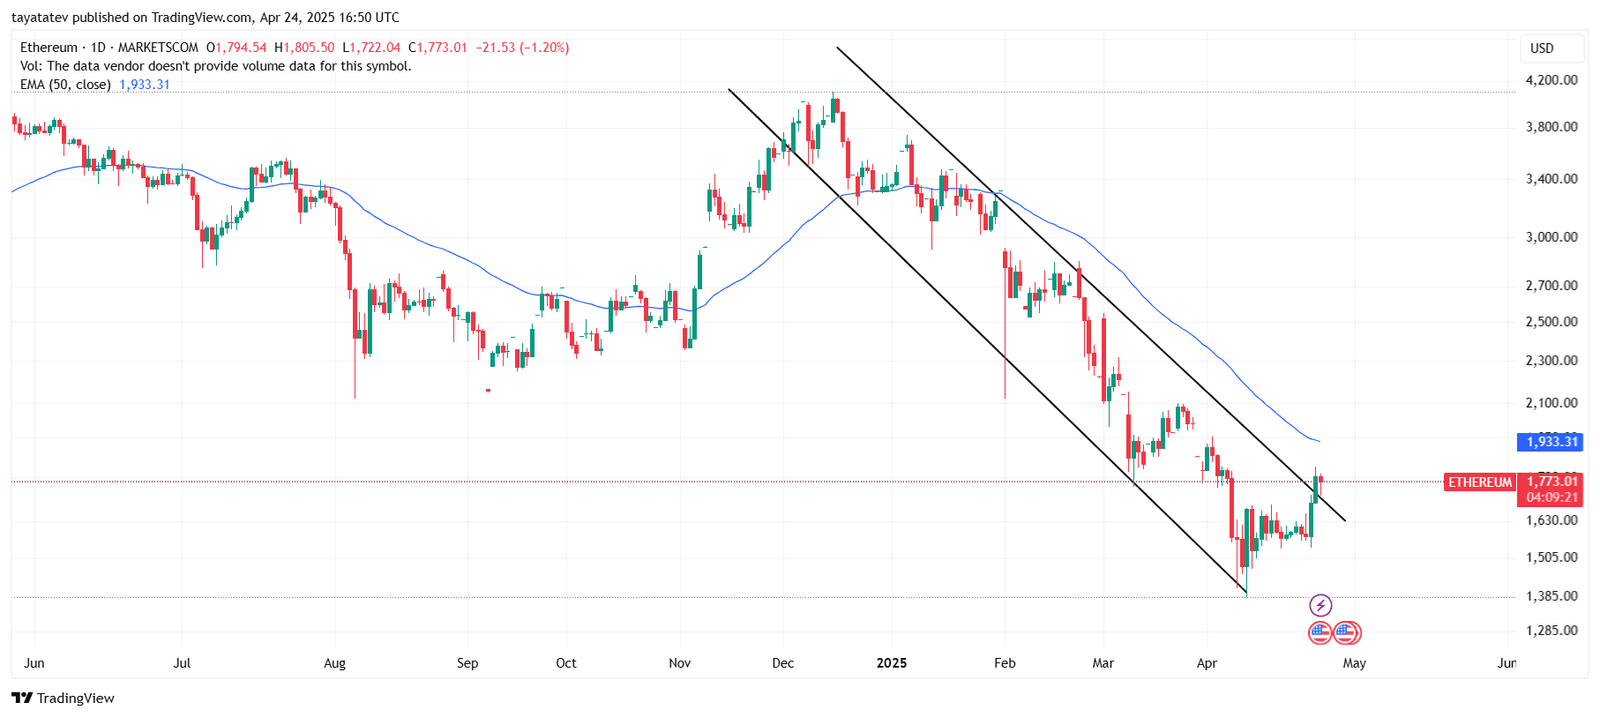
YEREVAN (CoinChapter.com) — Ethereum (ETH) is still stuck in a broader downtrend on the daily chart. The 50-day exponential moving average (EMA), currently near $1,933, remains above the price, acting as resistance. Ethereum tried to break above a falling parallel channel but failed to sustain the move. This pattern, often seen during downtrends, shows consistent lower highs and lower lows. The breakout attempt suggests buying pressure, but the rejection means bears are still active.
Bullish Flag Pattern Suggests Breakout on Lower Timeframe
On the 4-hour chart, Ethereum shows a clear bullish flag pattern. This pattern forms after a sharp upward move, followed by a small downward-sloping consolidation. It often signals continuation of the prior uptrend. In this case, the pole of the flag began from $1,585 and extended to $1,773.
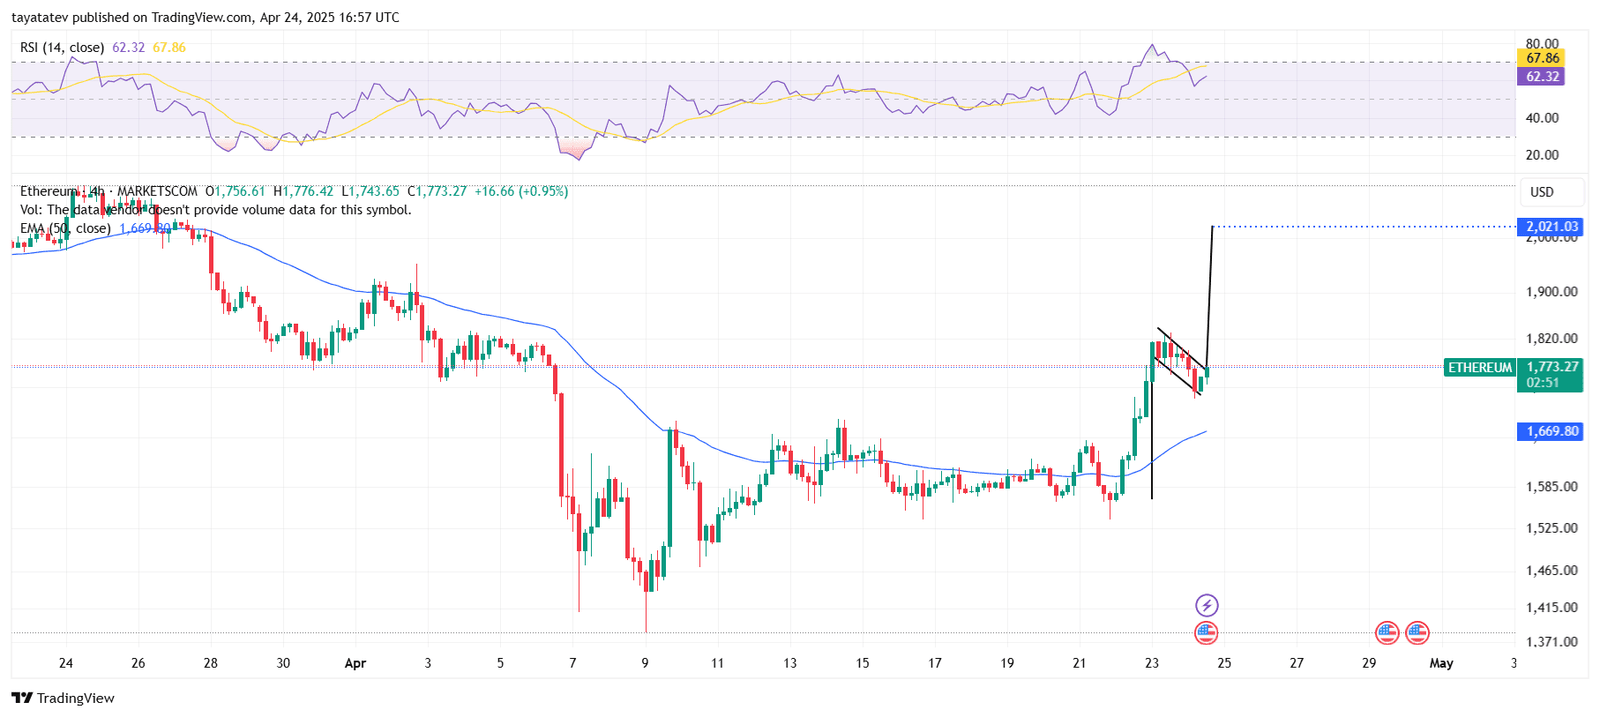
A bullish flag is known for short-term pauses before price continues in the same direction. Ethereum broke out of the flag pattern and is now targeting the next key level around $2,021.03. This target comes from measuring the length of the flagpole and projecting it from the breakout point.
The 50 EMA on the 4-hour chart now supports the price from below, sitting at $1,669.80. As long as Ethereum holds above this level, bullish momentum may continue. The Relative Strength Index (RSI) is also bullish. It currently reads 62.32, suggesting there’s room for more upward movement before ETH becomes overbought.
If this bullish setup plays out, Ethereum could gain about 14% from the breakout point. However, failure to hold above $1,750 would invalidate the setup.
Institutions Sell as Ethereum Hits Resistance
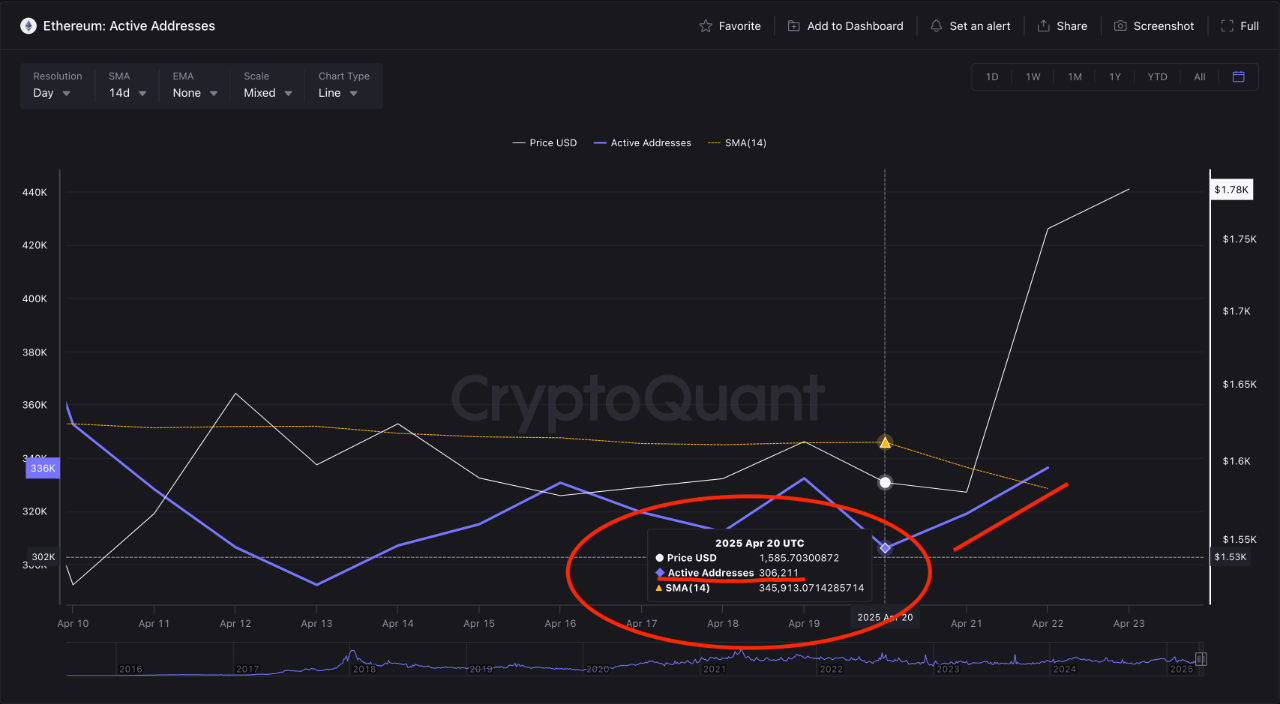
Ethereum’s price recovery came with growing on-chain activity, yet large players began to sell once it neared a key resistance. From April 20 to 22, active ETH addresses jumped 10%—from 306,211 to 336,366—according to CryptoQuant. This spike in network activity came alongside a short-term price rise toward $1,830, signaling rising user interest.
However, while network signals improved, institutions moved in the opposite direction. As Ethereum approached the $1,895 zone—where 1.64 million ETH is held by investors from November 2024—selling pressure increased. Many holders in that range likely wanted to break even or take profit, causing a supply wall just below $1,900.
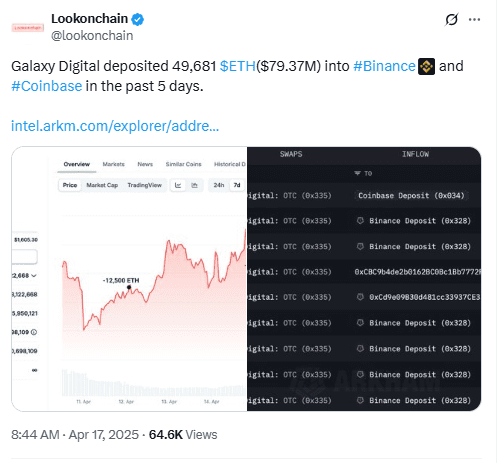
At the same time, Galaxy Digital reduced its Ether holdings significantly. The firm sent 65,600 ETH worth $105.5 million to Binance. This cut its balance from 98,000 ETH in February to 68,000 ETH, based on Arkham data.
CoinShares also confirmed broader institutional exit patterns, reporting $26.7 million in ETH fund outflows last week. That pushed total outflows to $772 million over the past two months. Despite that, ETH still holds a year-to-date net inflow of $215 million.
Meanwhile, Paradigm joined the sell-off. On April 22, it moved 5,500 ETH—worth $8.66 million—to Anchorage Digital.
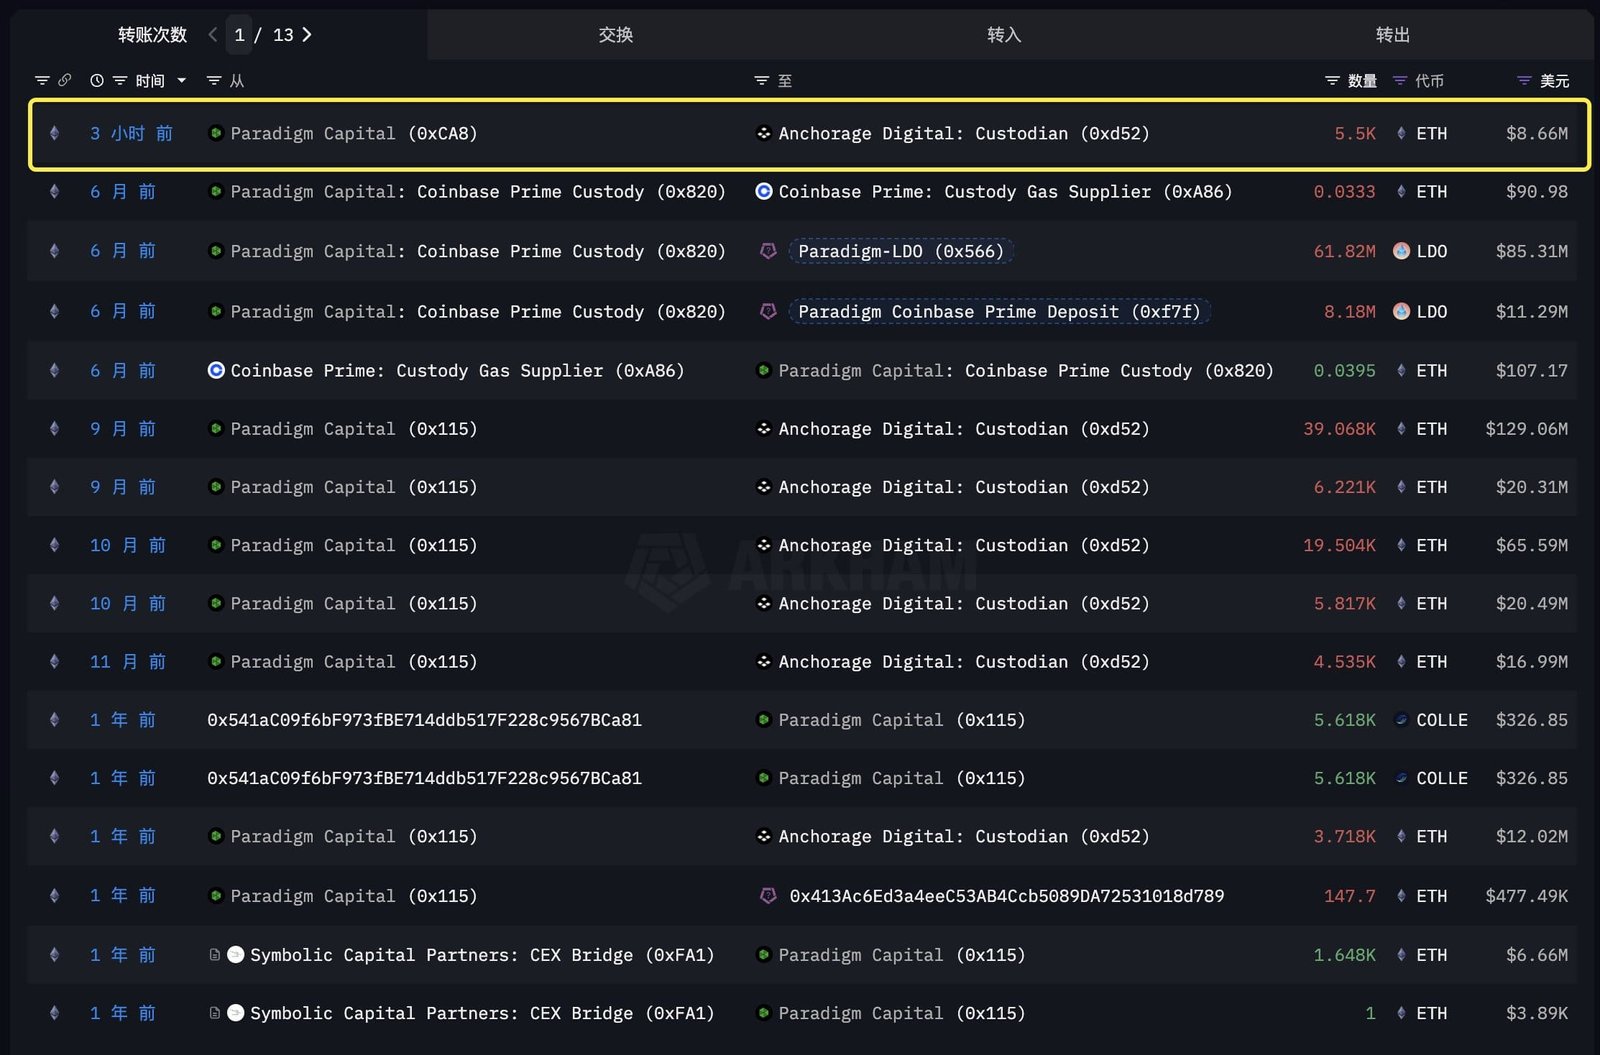
This action added to the broader trend of cautious exits near resistance.
