
Kaito AI (KAITO) price rose to $1.44 on June 25, rebounding 5.9% from its monthly low of $1.36 recorded on June 20. The price climbed 2.14% in 24 hours and 0.60% in the past hour.
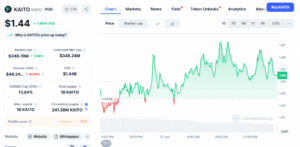
Trading volume reached $48.14 million, up 35.4% relative to its average from the previous week. KAITO’s market cap now stands at $349.1 million, with 241.38 million tokens in circulation.
From the May high of $2.43, KAITO had earlier declined 44% before staging this recent rebound.
KAITO posted the strongest 1-hour and 24-hour gains among top-ranked AI and Big Data tokens, most of which remained in negative territory.

While Bittensor and NEAR have larger market caps than KAITO, they underperformed in the short term. KAITO’s trading volume-to-market cap ratio stood at 13.8%, compared to FET’s 7.7% and ICP’s 2.4% — showing stronger trading efficiency.
Netflows, Liquidations, and Open Interest Reveal Spot-Driven Buying
Exchange netflows flipped positive over the past 48 hours, with inflows exceeding outflows. This shift followed last week’s sell-offs that pushed KAITO to its June low.
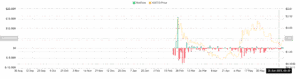
Liquidation data shows long positions have increased by ~18%, while short liquidations have dropped notably. However, total open interest fell 85% from its March peak, now sitting at $20.27 million. This indicates the current rally is driven by spot demand, not leveraged speculation.
Technicals Show Bullish Setup for KAITO, But Resistance Near
KAITO is currently testing the 50-day Exponential Moving Average (EMA) at $1.44. Just above it lies the 100-day EMA at $1.49, acting as near-term resistance. The RSI is at 45.36, showing that buying strength is improving but not yet dominant.
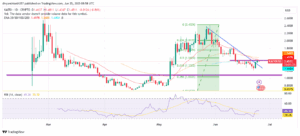
The price remains under a descending trendline drawn from the May 2025 high of $2.43, which continues to suppress upward momentum. That trendline intersects near the $1.49–$1.52 zone, making it a critical inflection level.
If KAITO closes above $1.49 and breaks the descending trendline, the next target lies at $1.65, representing a 14.6% gain from current levels. Further continuation could push price toward the $1.72 zone, a previous support from early May.
However, failure to reclaim $1.49 may lead to rejection and a retest of the $1.36 support, a 5.5% downside from current price. A break below that could expose the $1.24–$1.27 range, last seen in March.
Compared to ETH and BTC, KAITO shows isolated strength. Ethereum (ETH) dropped 1.09% in the past 24 hours, closing at $2,423.10. ETH has declined 26.56% over the past 90 days. Meanwhile, Bitcoin (BTC) has gained 6.05% in the same timeframe.
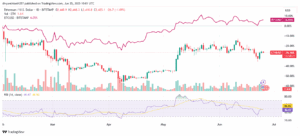
KAITO’s 2.14% 24-hour rise stands out against these top-layer blockchains, showing that its current momentum is not tied to a broader altcoin trend.
