
Litecoin (LTC) price extended its decline on Oct. 17, with the token’s gains from early in the day swiftly converting paring against bearish pressure. LTC price remained trading near $90 after repeated failures to start a move towards $100. LTC bulls failed to push the token higher as market participants awaited clarity on the anticipated ETF decision.
Despite the weakness, analysts, such as Pelin Ay and Minimilian, maintained a long-term bullish stance, describing Litecoin’s structure as a years-long accumulation phase nearing a potential breakout stage.
Analysts Outline Conflicting Litecoin Setups Amid ETF Speculation
XForceGlobal described Litecoin’s ongoing structure as the final coiled-up phase of a multi-year accumulation pattern.
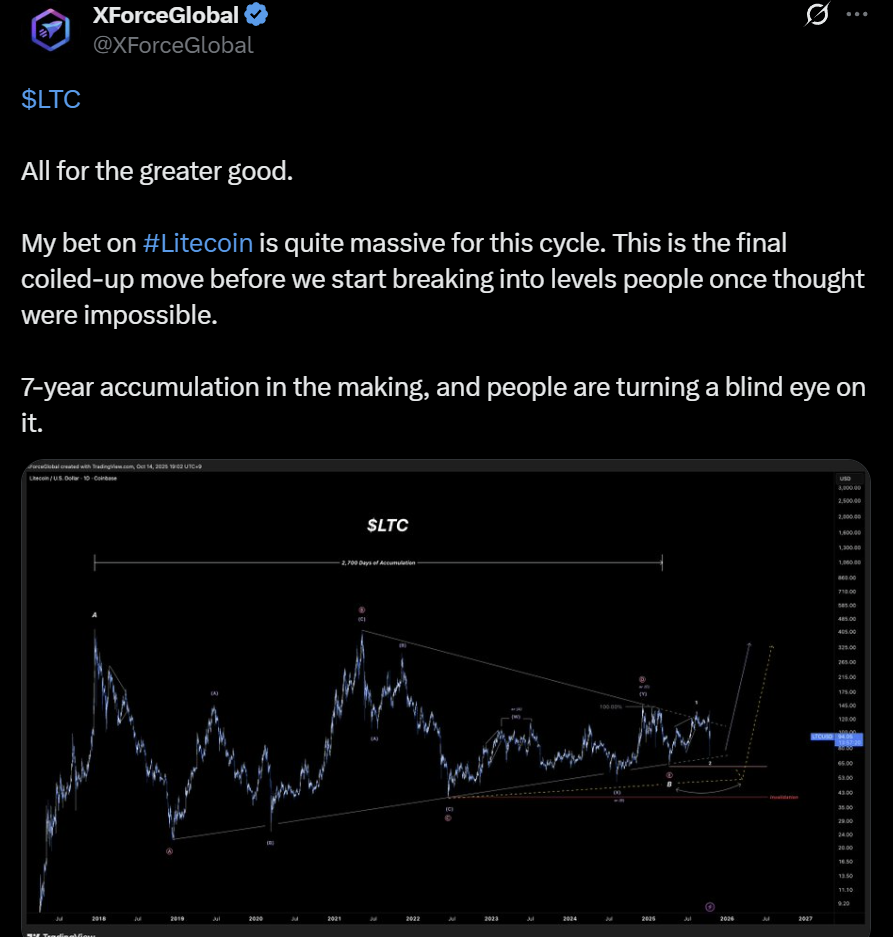
The analyst shared a chart showing a symmetrical triangle spanning nearly seven years, suggesting that LTC had been preparing for an explosive move. The post identified a long-term support base near $65 and emphasized that a sustained breakout above $120 could mark the start of a major cycle expansion.
Pelin Ay, meanwhile, approached the setup from a shorter timeframe, linking price movement to the pending ETF verdict.
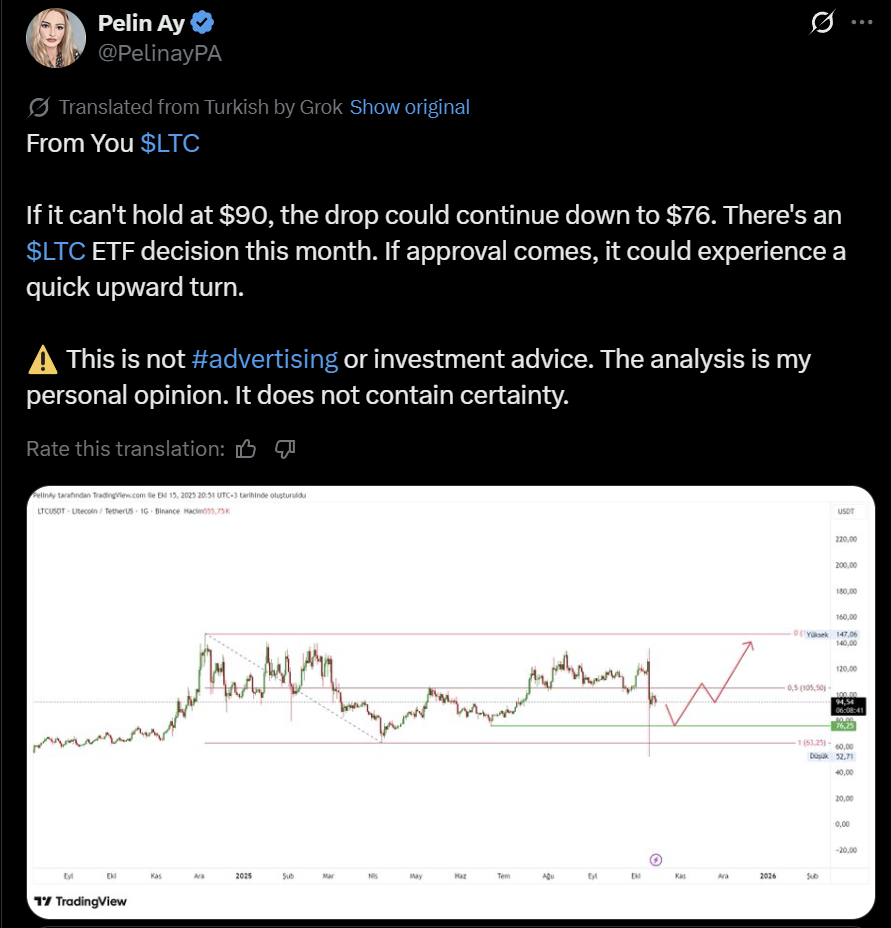
Ay’s analysis indicated that if Litecoin failed to hold $90, the token could slide toward $76, which aligns with the next visible support band. The analyst noted that an ETF approval could quickly reverse sentiment and push LTC price back toward $140. Pelin’s projection followed a Fibonacci-based retracement model, showing an initial drop before a rebound toward the upper resistance zone.
Minimilian reinforced the broader bullish outlook, stating that Litecoin remained in a long-term uptrend within a narrowing wedge pattern.
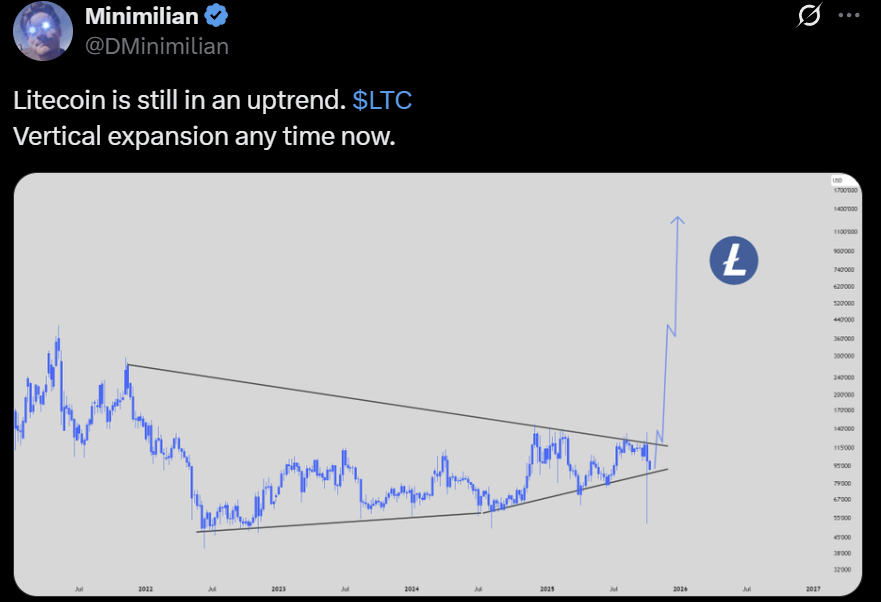
The analyst’s chart depicted a tightening structure with rising lows since 2022, suggesting upward compression before a vertical breakout. The setup mirrored XForceGlobal’s perspective but focused more on the structural timing of a potential move rather than immediate catalysts.
Crypto Lama offered a different interpretation using the Litecoin Rainbow indicator. Lama noted that LTC’s current position near the lower bands historically signaled undervaluation zones that preceded rallies. The chart reflected repeated tests of the mid-range channels, hinting that Litecoin might attempt another cyclical advance if it maintains stability above the lower blue zone.
Key Technical Levels Define Token’s Next Move
That backdrop met a chart still anchored to clear levels. Litecoin held above immediate support near $87, with additional cushion near $78.
The immediate resistance sat near $101. Price closed beneath the 20, 50, 100, and 200-day EMAs, which clustered just below $105 and reinforced overhead supply.
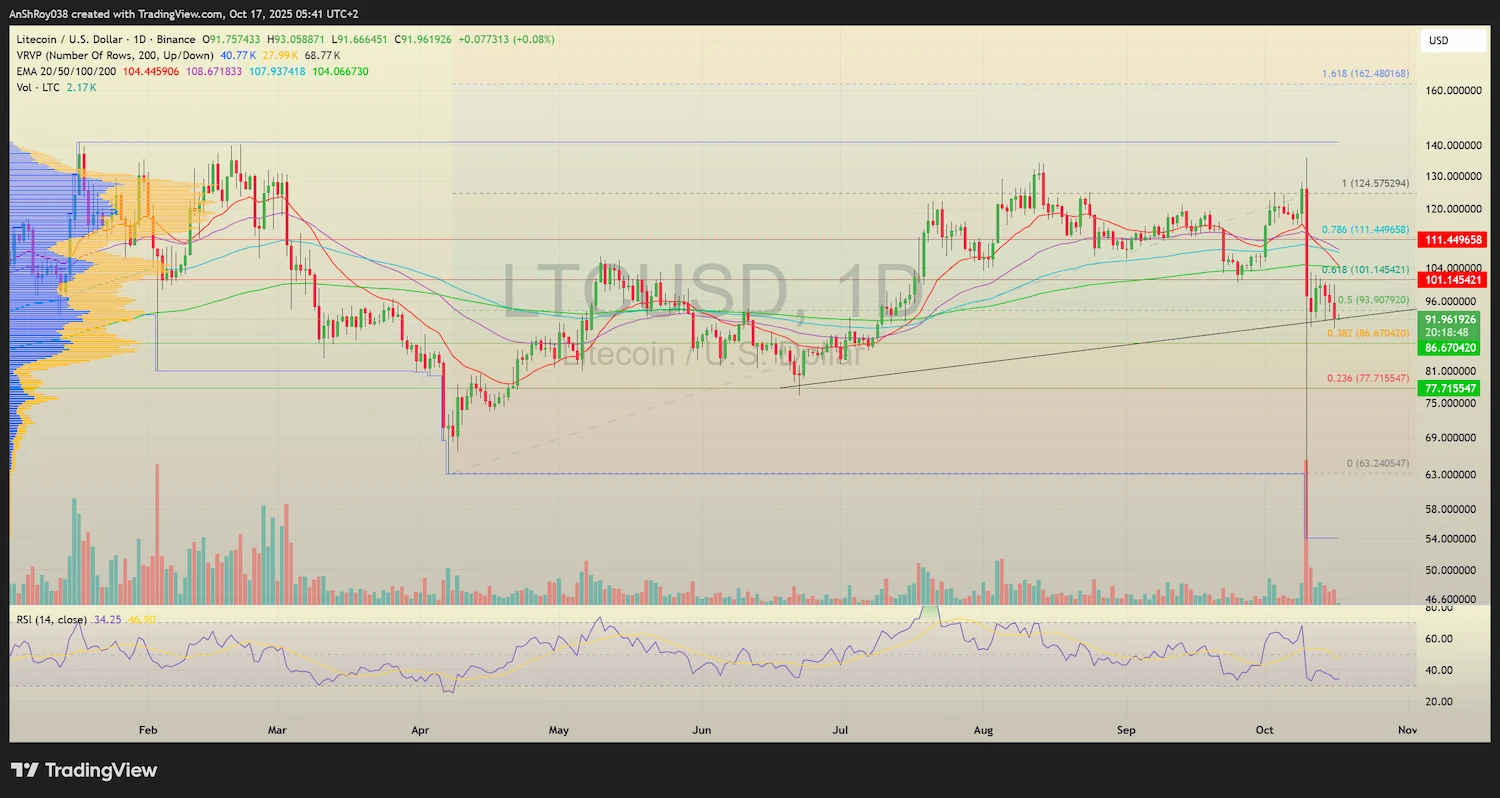
Flipping the immediate resistance would help the LTC USD pair target the resistance near $104. A decisive daily close above that band would then open the path toward the next resistance near $111. Failure to reclaim $101 would keep bears in control and preserve the lower-high sequence.
Volume confirmed the stress test. The visible range profile showed the heaviest participation in the mid-$90s, aligning with current churn and explaining sticky intraday rejections.
Structure remained balanced but fragile. As long as Litecoin stayed above $87, bulls kept a workable base with clear risk lines in the region around $78. A breakdown through those floors would invite trend acceleration and invalidate near-term recovery attempts. Conversely, successive closes above $101 and $104 would neutralize the decline and shift the bias toward $111.
Moreover, flipping $104 would signal improving breadth across the EMAs. However, only a push into $111 would complete a credible momentum reset and revive the larger accumulation narrative the analysts outlined.
Disclaimer: The analysis above reflects the author’s personal market views and is provided for informational purposes only. It should not be considered financial or investment advice. Readers must conduct their own research, or consult a licensed adviser, before making investment decisions. Any losses incurred from acting on this analysis will not be the responsibility of the author or CoinChapter in any way. The author may hold Bitcoin, Ethereum, or other cryptocurrencies.
