Litecoin (LTC) has formed a Golden Cross on the weekly chart, according to analyst Lark Davis. The analyst stated that Litecoin has only produced this signal twice before. Both times, the price advanced significantly. In 2017, Litecoin’s Golden Cross was followed by a rally lasting about six months that drove the price more than 700% higher. In 2021, the second Golden Cross led to a rally of roughly 450% over four months. Davis pointed out that the pattern is rare and historically linked with strong price gains.
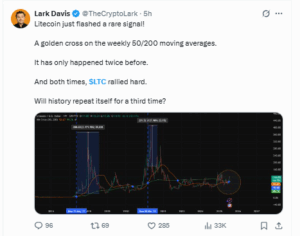
A Golden Cross occurs when the 50‑week moving average rises above the 200‑week moving average. Traders view the crossover as a sign that long‑term momentum may be shifting upward.
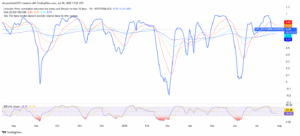
Litecoin (LTC to USD) is trading near $111 after recently moving above $115. The daily chart shows a bullish alignment of moving averages, with shorter‑term averages above longer ones.
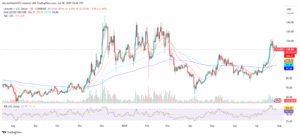
The Relative Strength Index (RSI) is around 61. RSI measures the speed and strength of price changes on a scale of 0 to 100. Readings above 70 are considered overbought, while levels between 50 and 70 indicate steady momentum. Litecoin’s current RSI suggests moderate strength without signs of overheating.
Whales Add to Holdings While Litecoin Exchange Supply Shrinks
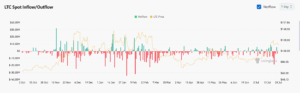
Exchange data shows that more Litecoin has been leaving exchanges than entering in recent months. Such outflows often suggest holders are moving coins into long‑term storage instead of keeping them ready for sale. In addition, large holder netflow has been positive since May. This shows that major wallets, often called whales, have been adding to their holdings rather than reducing them.
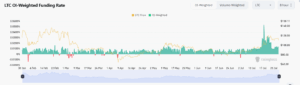
Open interest in Litecoin futures has risen alongside recent price gains. Open interest tracks the total value of active contracts. Rising open interest usually indicates increasing participation.
The funding rate for these contracts is slightly positive. Funding is a fee paid between traders to balance long and short positions. A positive rate signals more demand for long positions, or bets on higher prices. Because the rate remains modest, it suggests bullish positioning without extreme leverage risk.
MVRV Reading Signals Litecoin Market Still Far From Overheated
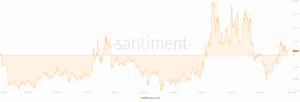
Litecoin’s Market Value to Realized Value (MVRV) ratio is around 4%. The MVRV compares the market price with the average cost at which coins last moved. Very high ratios, such as above 30%, often signal overvaluation and a risk of correction. At 4%, holders are in small profit, but the market does not appear overheated.
Whale transfers above $1 million remain steady, showing consistent activity from large players.
Litecoin maintains a 30‑day correlation of 0.78 with Bitcoin. A correlation close to 1 indicates the two assets move together most of the time. This means Litecoin’s ability to sustain a breakout will likely depend on Bitcoin’s broader trend.
Analyst Sees $330–$550 Range if Rally Mirrors Past Patterns
Davis noted that the last two Golden Crosses led to rallies exceeding 400%. If Litecoin were to follow a similar pattern now from its current price of $111, the price could climb toward the $550 range.
However, Davis also observed that the second Golden Cross produced smaller returns than the first, suggesting diminishing gains. If that pattern continues, Litecoin could rise by 200% to 300%, placing it between $330 and $440.
The Golden Cross is a lagging indicator, meaning it confirms trends that may already be underway rather than predicting new ones. If Bitcoin weakens, Litecoin’s close correlation could limit upside potential. A shift from exchange outflows to inflows might also add selling pressure. In addition, while miner and whale support remains strong, a reversal in those trends could challenge the bullish setup.
