
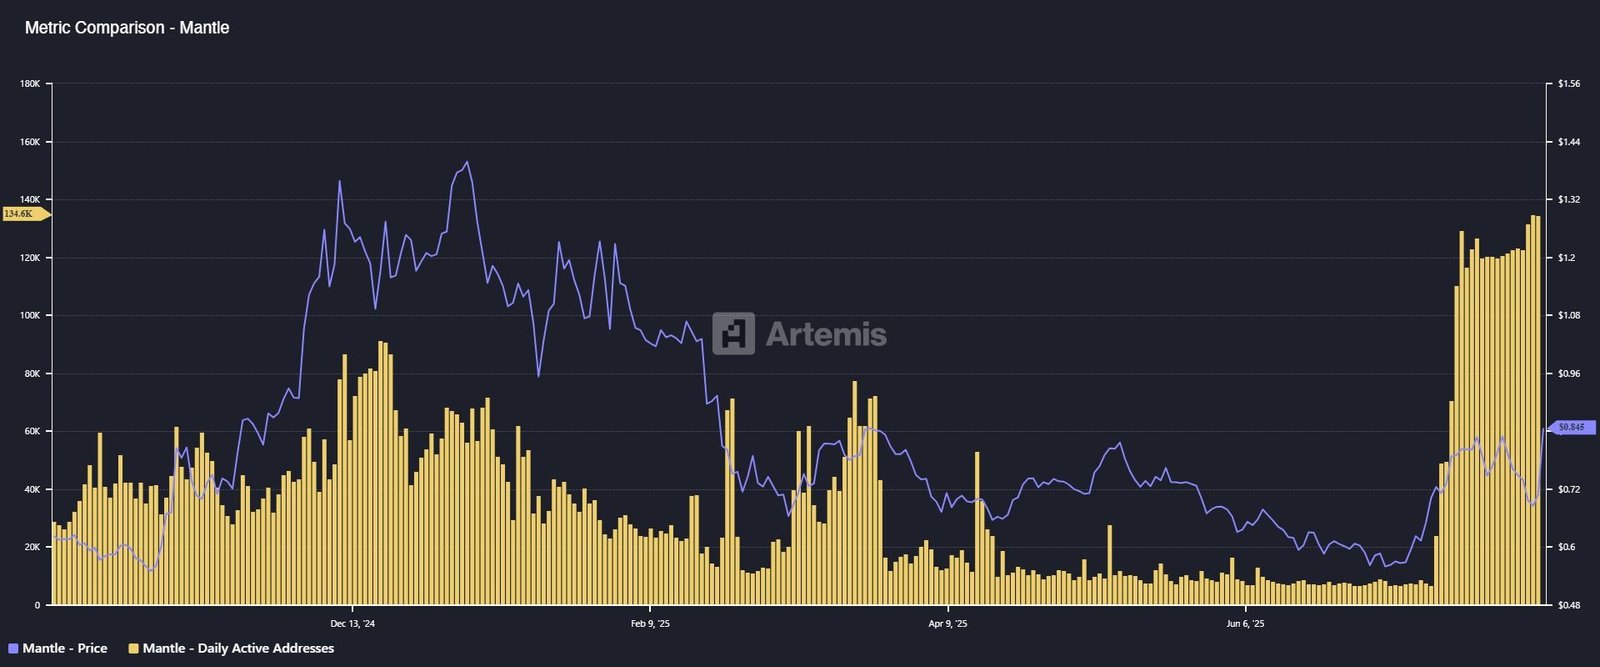
Mantle (MNT) saw daily active addresses rise by 1,600% in one month. Data from Artemis Analytics showed an increase from 7,000 to 120,000. This rise started in mid-July and continued into August, signaling a sharp rise in user activity.
The growth aligned with Mantle joining the Strategic ETH Reserve (SΞR). This move strengthened Mantle’s position in the broader Ethereum-linked ecosystem. Investor CyrilXBT said,
“Whales are buying the dip on this beast for a reason. Mantle just joined the Strategic ETH Reserve (SΞR) — a quiet flex with massive implications.”
This shift also connected Mantle’s price movement with Ethereum’s performance. ETH rose from $3,000 to $4,000 during the same period, further influencing MNT’s trading behavior.
Mantle Allocates $392 Million ETH to Strategic ETH Reserve
Mantle allocated 101,867 ETH, worth $392 million, to the Strategic ETH Reserve (SΞR). This made Mantle the 8th-largest ETH holder among Web3 entities.
The ETH allocation tied Mantle’s price closely to ETH trends. As ETH gained value since mid-July, Mantle reflected the upward movement. This ETH-based reserve placed Mantle among entities holding significant ETH treasuries, boosting its on-chain presence.
Data also highlighted that Mantle’s treasury structure increased its correlation with ETH’s performance, making ETH price changes a direct factor in MNT’s price moves.
mETH Staking Drives Institutional Use of Mantle
The mETH Protocol on Mantle provides staking and restaking options for ETH. mETH Protocol stated,
“Mantle holds one of the largest ETH-denominated treasuries on-chain: over $320 million across mETH, cmETH, and ETH.”
Institutional interest grew when Republic Technologies converted a major share of its ETH holdings into mETH during Q2/2025. This integration linked institutional capital to Mantle’s network activity.
This ETH staking system connects Mantle to ETH-backed yield generation while increasing utility for both ETH and MNT on-chain.
UR Platform Links Mantle to TradFi-DeFi Integration
Mantle also launched UR, a financial platform built on its network. UR connects traditional finance (TradFi) and decentralized finance (DeFi), expanding Mantle’s ecosystem to more financial use cases.
Trader Tardigrade commented,
“MNT has started moving again. It’s gaining significant momentum and shows no signs of stopping. I believe the price increase is linked to their recently launched UR.”
This platform adds to Mantle’s activity by tying its blockchain to services built for broader finance integration.
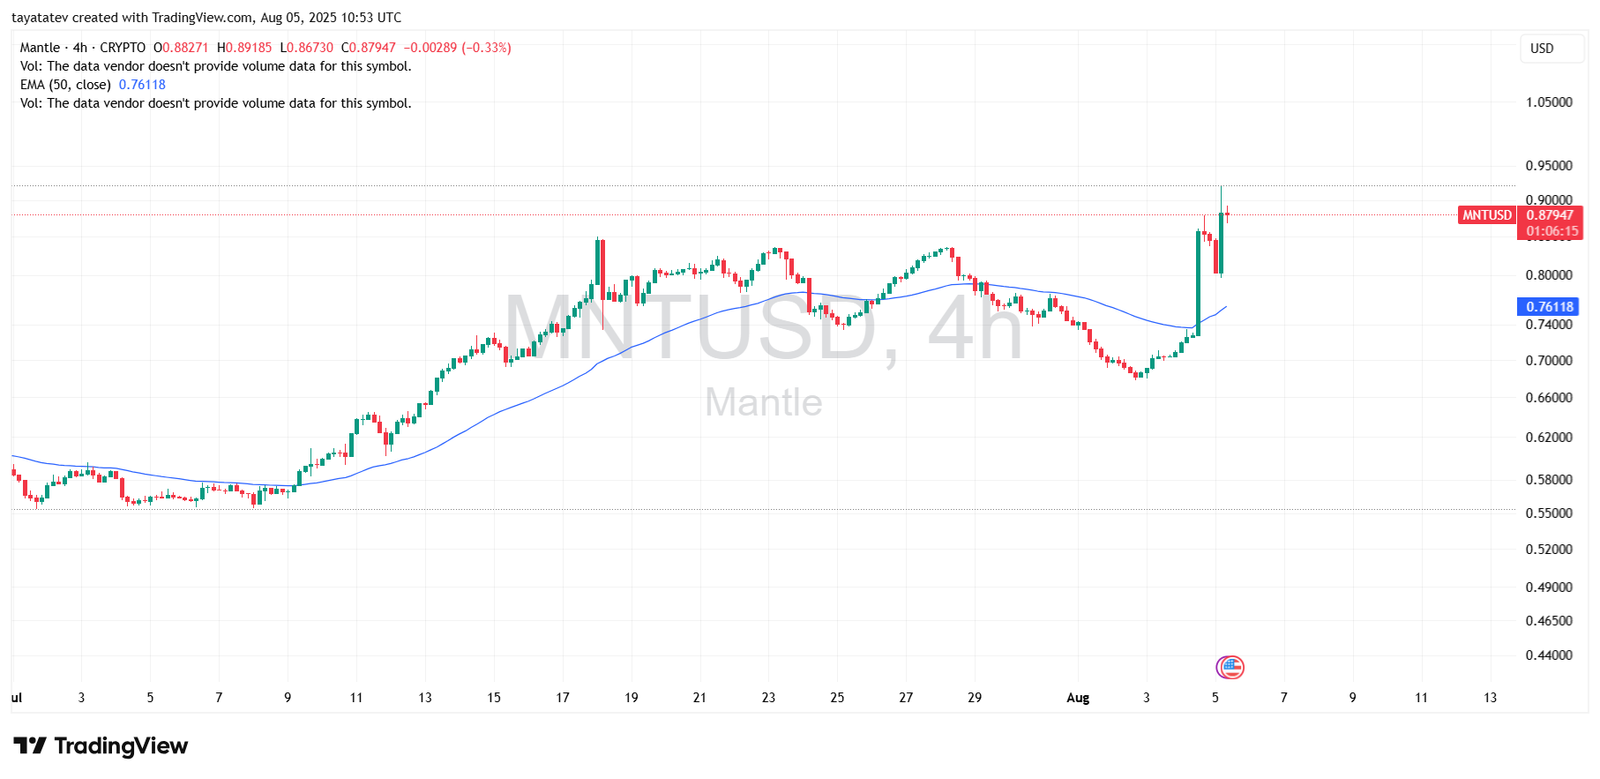
Mantle Price Reaches $0.88 After Sharp Increase
Mantle MNT/USDT rose to $0.88 on August 5, marking its highest level since March. The token’s price gained over 30% since early August, supported by a trading volume spike exceeding $500 million within 24 hours. The chart shows MNT maintaining strong momentum, with the 50-day EMA at $0.76 acting as a support level during its recent climb.
The Relative Strength Index (RSI) for Mantle (MNT) is currently at 72.61, above the standard overbought threshold of 70. This level indicates that recent buying pressure has been strong, following its sharp price increase to $0.88.
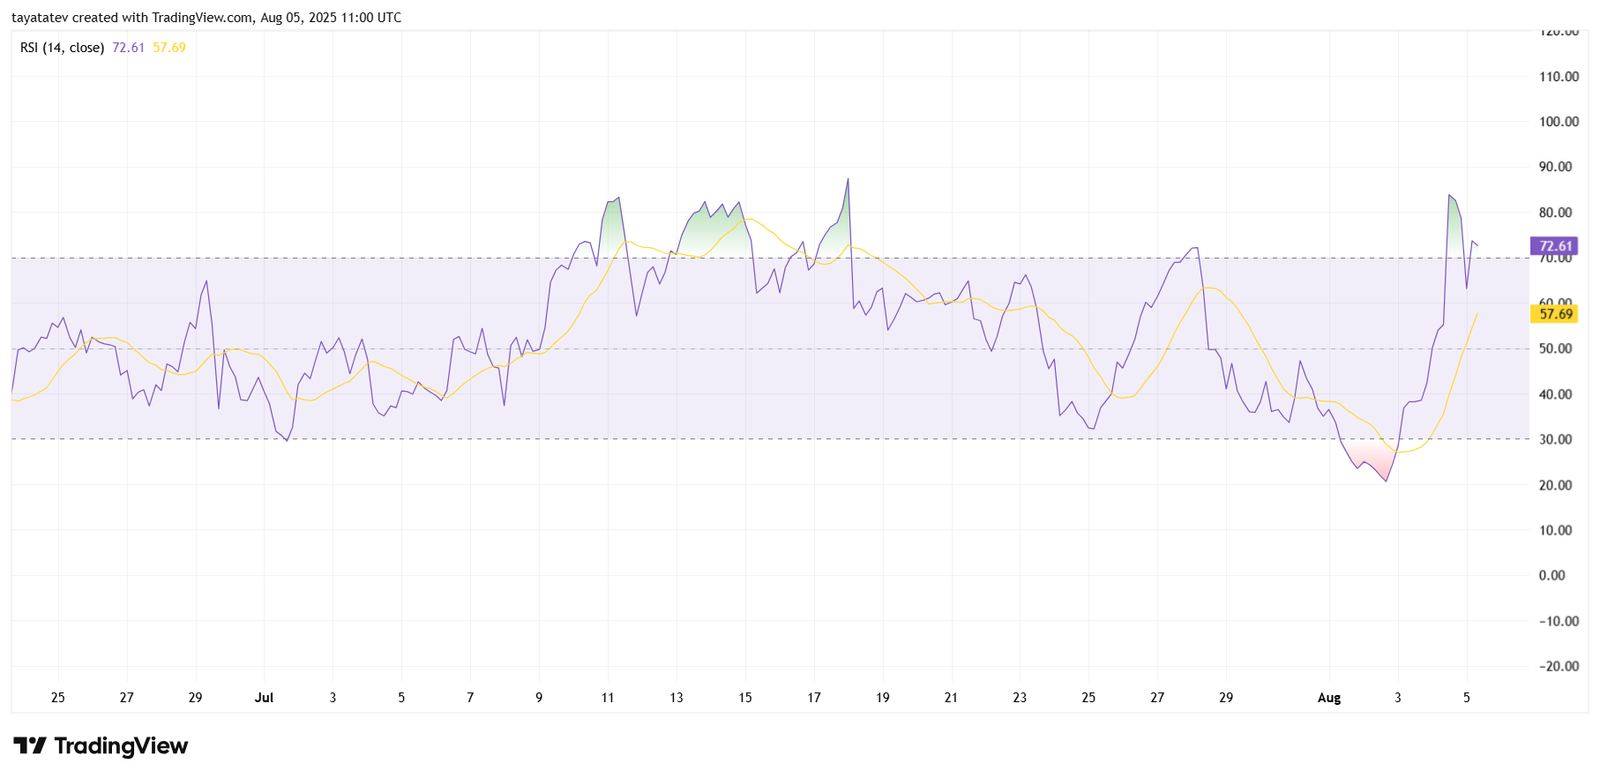
The RSI climbed rapidly from below 30 on August 3 to its current level, showing a significant shift in momentum. This rise aligns with the broader price surge observed in early August, supported by higher trading activity.
The RSI moving average (14, close) is at 57.69, confirming the strength of upward momentum. The sharp divergence between the RSI and its average reflects a concentrated phase of buying interest, coinciding with Mantle’s recent rally.
Mantle MACD Signals Strong Bullish Momentum
The Moving Average Convergence Divergence (MACD) indicator for Mantle (MNT) shows a clear bullish trend. The MACD line, calculated as the difference between the 12-period Exponential Moving Average (EMA) and the 26-period EMA, is at 0.01995. This value is above the signal line (the 9-period EMA of the MACD), which stands at 0.01382.
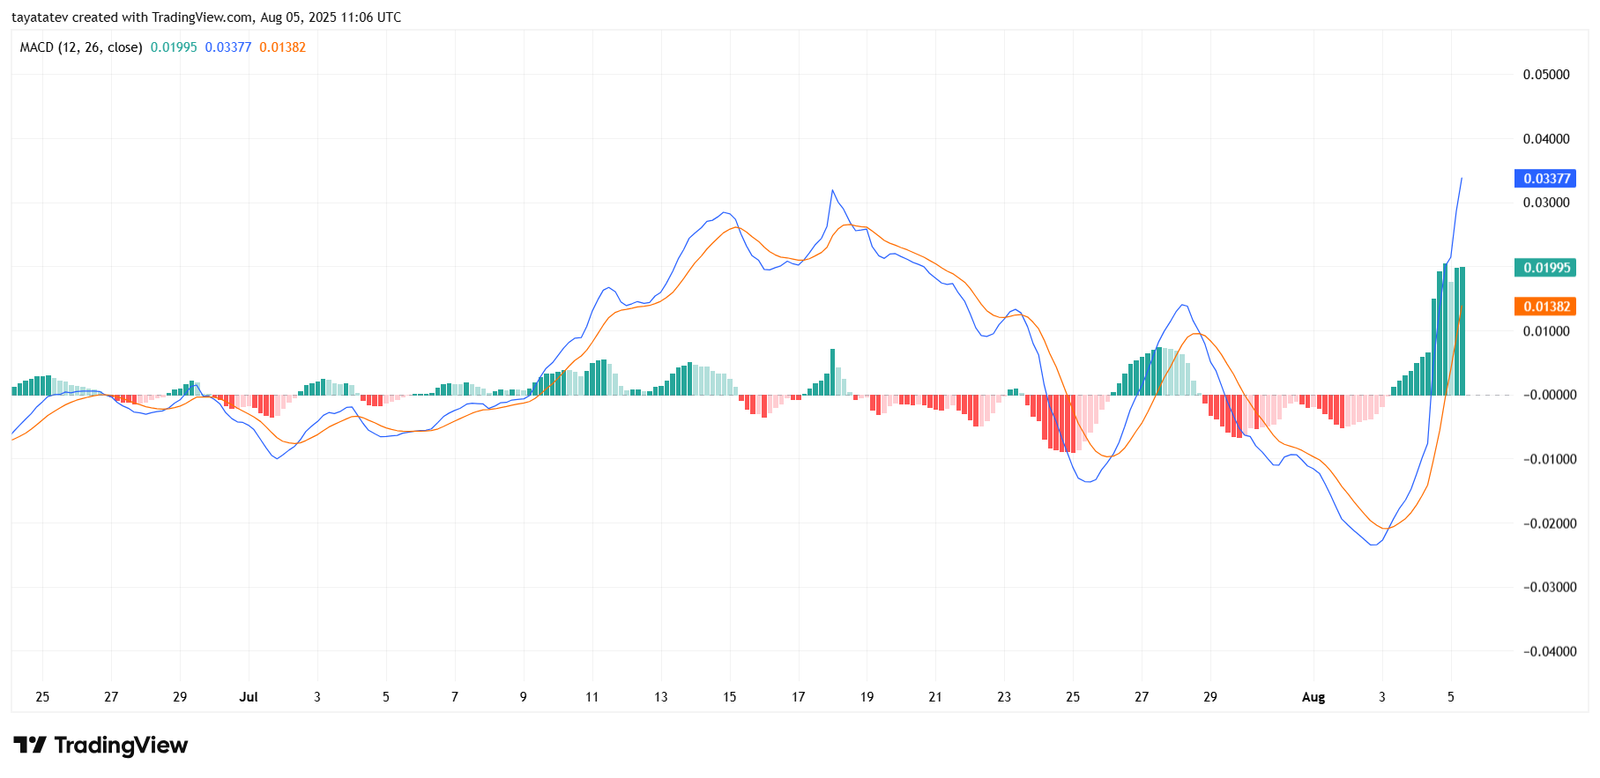
When the MACD line crosses above the signal line, it reflects positive momentum. This crossover indicates that Mantle’s short-term price movement is gaining strength faster than its longer-term trend. The green histogram bars confirm this, showing increasing distance between the MACD and the signal line.
Additionally, the MACD histogram has shifted from negative to positive territory, reinforcing the upward momentum. This shift aligns with the recent price rise to $0.88, suggesting that market activity supports sustained buying pressure during this period.
Mantle DMI Indicates Strengthening Trend Momentum
The Directional Movement Index (DMI) for Mantle (MNT) highlights rising trend strength. The DMI consists of three components: the Positive Directional Indicator (+DI), the Negative Directional Indicator (−DI), and the Average Directional Index (ADX).
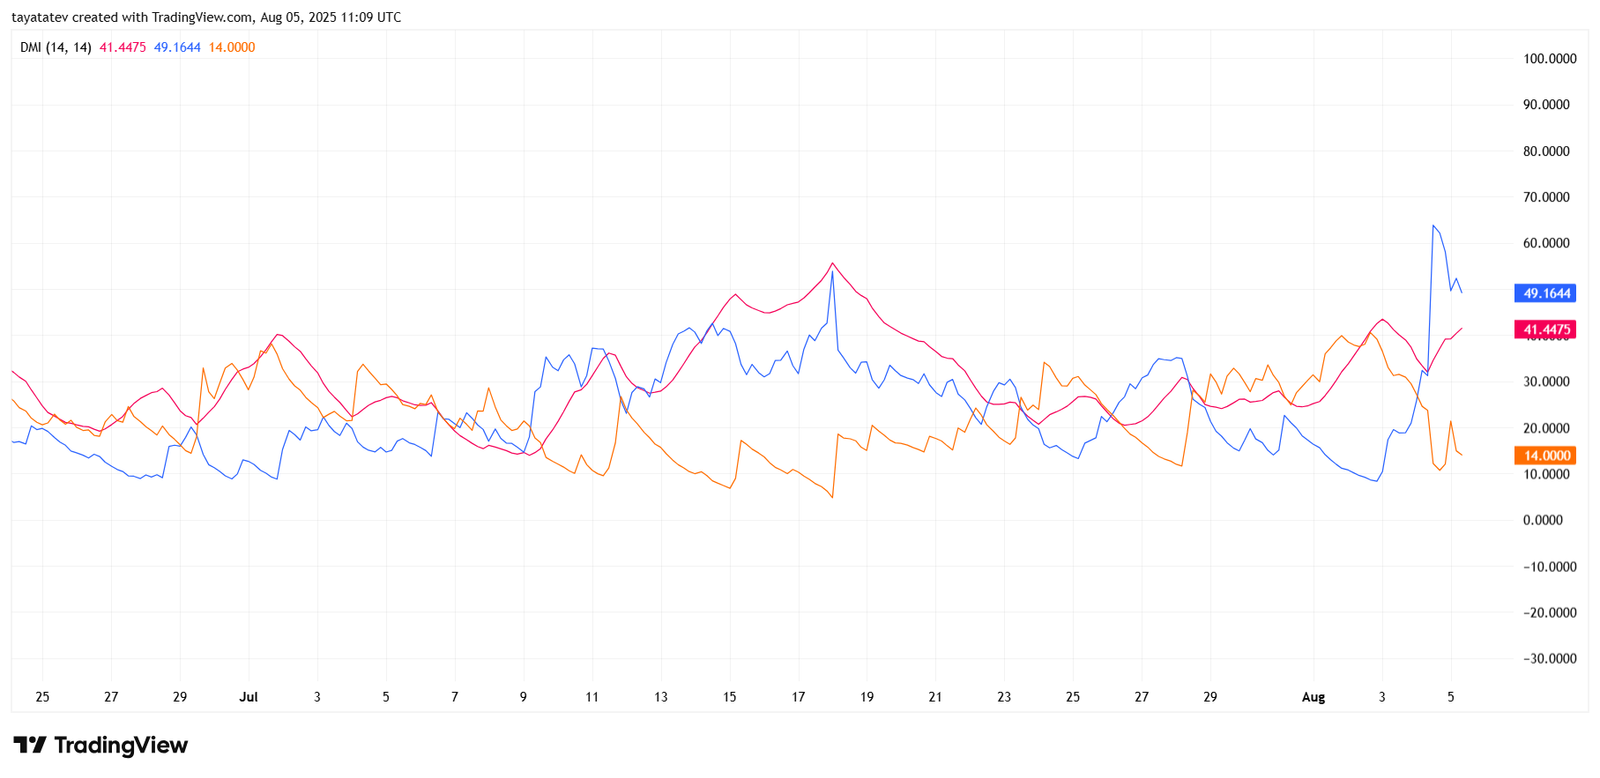
The +DI is at 49.16, while the −DI stands at 41.44, showing that buying strength is exceeding selling pressure. The ADX, which measures overall trend strength regardless of direction, is currently 14.00. Though this ADX value remains low, its upward slope indicates growing trend momentum.
The recent increase in +DI aligns with Mantle’s price move to $0.88, while the decline in −DI signals reduced selling activity. The widening gap between these two indicators reinforces the dominance of upward price movement during this period.
