NEWT Token Jumps 146% After Post-Listing Crash Chart Signals Explained
SHARE
The launch of Newton Protocol’s NEWT token triggered high activity across major exchanges, but the market quickly turned against it. Within 24 hours of going live, the token’s price dropped 45% from $0.83 to $0.46, despite bullish momentum from two key announcements.
On June 24, Binance announced the listing of NEWT, paired with a promotional airdrop. The campaign pushed 215 million tokens into circulation. Around the same time, Coinbase also enabled trading for NEWT, adding further exposure on top-tier platforms.
- Advertisement -
Newton Protocol Binance Airdrop Announcement. Source: Binanceon X
These two listings sparked initial enthusiasm among traders. Market watchers expected strong upside movement, especially as visibility surged across the crypto sector.
However, the price of NEWT moved in the opposite direction. Data from Santiment showed that trading volume surged to $823.73 million in 24 hours, indicating intense exchange activity. Still, the spike in volume came with falling prices—an early sign of heavy selling pressure.
Such a pattern typically signals distribution. In this case, many airdrop recipients and early investors likely sold their tokens to take profits. The result was a sharp correction that overpowered any buy-side momentum.
- Advertisement -
Built on Ethereum, Newton Protocol provides a decentralized infrastructure for verifiable on-chain automation and secure agent authorization. The project targets Web3 developers who want to build automated applications using smart contracts.
The NEWT token powers the protocol. As an ERC-20 token, it covers network fees, enables smart contract interactions, and supports governance.
NEWT Token Soars 146% in Two Days After Earlier Crash
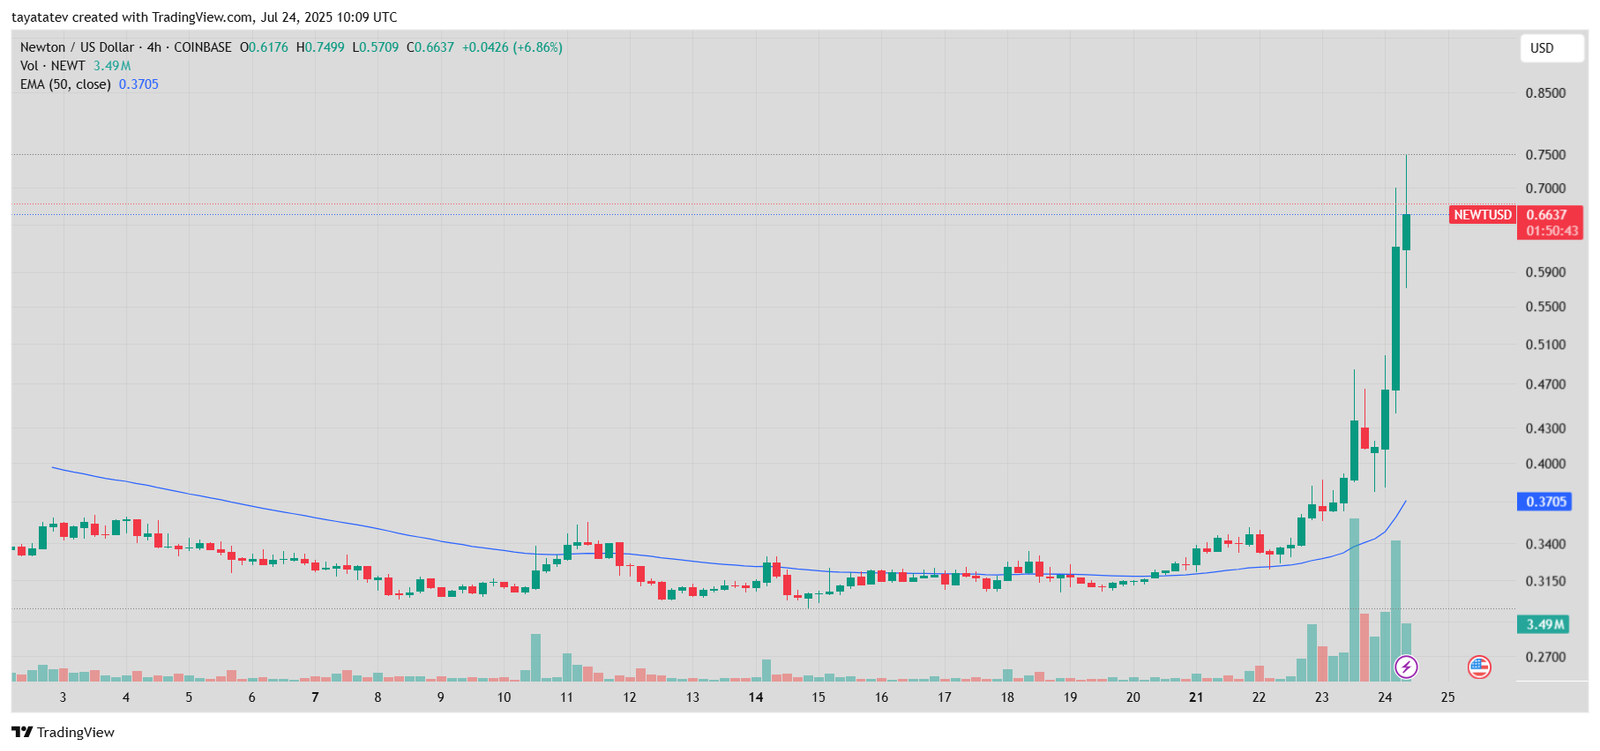
Newton Protocol’s native token NEWT rebounded sharply, gaining over 146% in just two days. According to TradingView data, the price climbed from $0.27 on July 22 to a peak of $0.7490 by July 24, 2025. The chart reflects a strong rally supported by rising volume and a clear breakout above the 50-period exponential moving average.
The latest 4-hour chart from Coinbase shows consistent green candles starting July 22. The trading volume rose significantly during this period, with 3.49 million NEWT tokens traded at the latest count. This volume increase confirmed strong buying interest after a sharp decline earlier in the week.
NEWTUSD 4-Hour Chart. Source: TradingView
The price had been trading below the 50-period exponential moving average—shown as a blue line—until July 22. That average was positioned around $0.3705. Once the price crossed this level, momentum accelerated.
On July 22, NEWT traded as low as $0.27 after falling from its initial listing price of $0.83 on June 24. The decline followed a wave of profit-taking by airdrop recipients. However, this latest reversal signals renewed interest in the token, possibly from traders buying the dip after overselling.
From its July 22 low to the July 24 high of $0.7490, NEWT gained approximately 177%. As of the latest update, the token trades at $0.6637, still up 146% from its recent bottom.
- Advertisement -
The sharp recovery suggests that NEWT has entered a new price discovery phase. Momentum remains strong, but volatility is also increasing.
MACD Chart Confirms Strong Bullish Momentum for NEWT
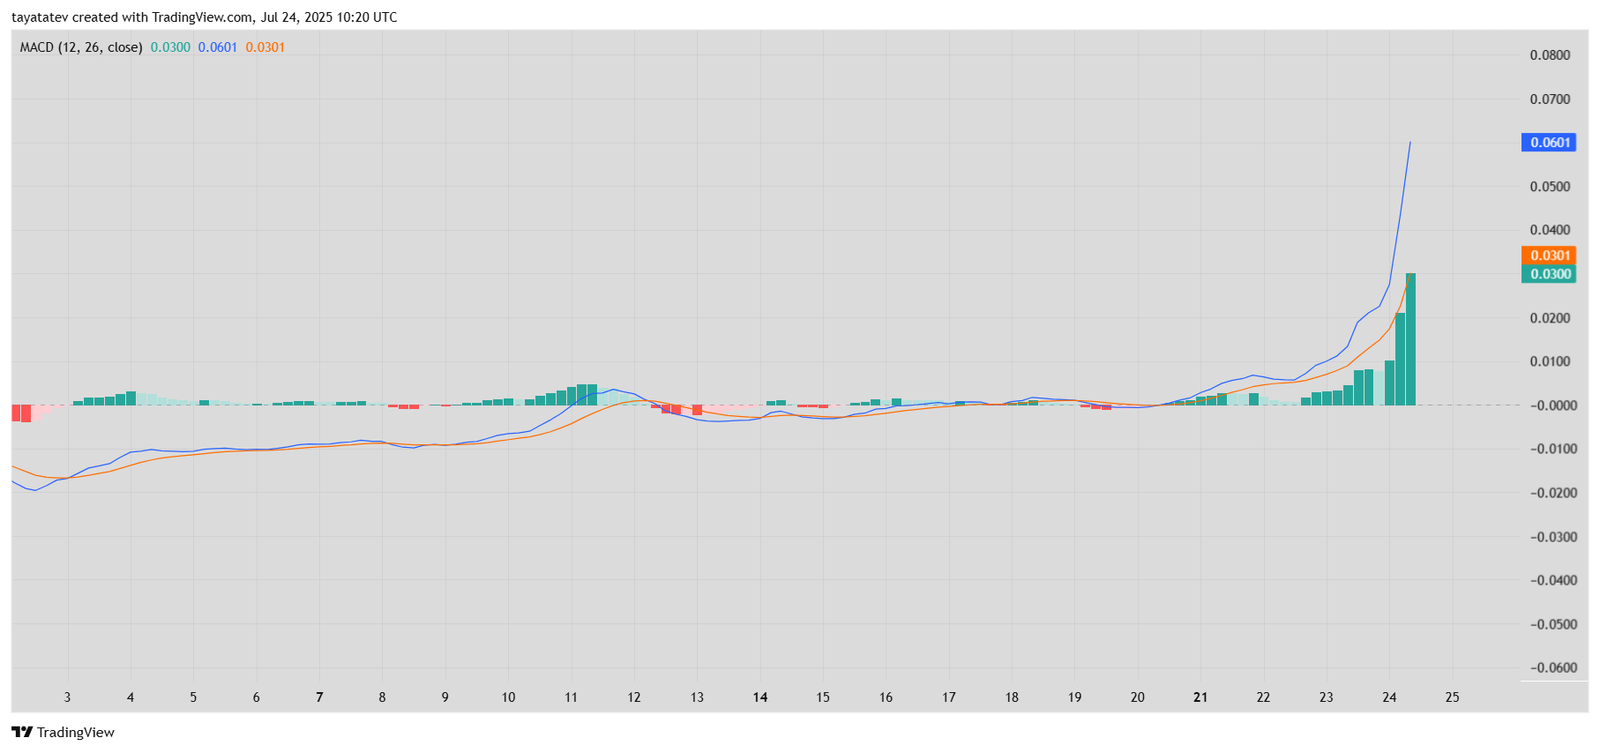
The Moving Average Convergence Divergence (MACD) chart for Newton Protocol’s NEWT/USDT token shows a clear bullish trend. On July 22, the MACD line (blue) crossed above the signal line (orange), marking the start of upward momentum. Since then, the gap between the two lines has widened sharply. As of July 24, the MACD line has reached 0.0601, while the signal line sits at 0.0301.
MACD Momentum Indicator. Source: TradingView
The histogram also supports this move. Green bars have grown taller with each session, reflecting increasing strength behind the rally. The indicator measures the difference between the MACD and signal lines and confirms that momentum continues to build.
The MACD chart, based on 12-period and 26-period exponential moving averages, matches the strong price breakout seen on the 4-hour chart. Together, these signals point to sustained buying pressure and a bullish short-term trend.
NEWT RSI Enters Overbought Zone With Sharp Acceleration
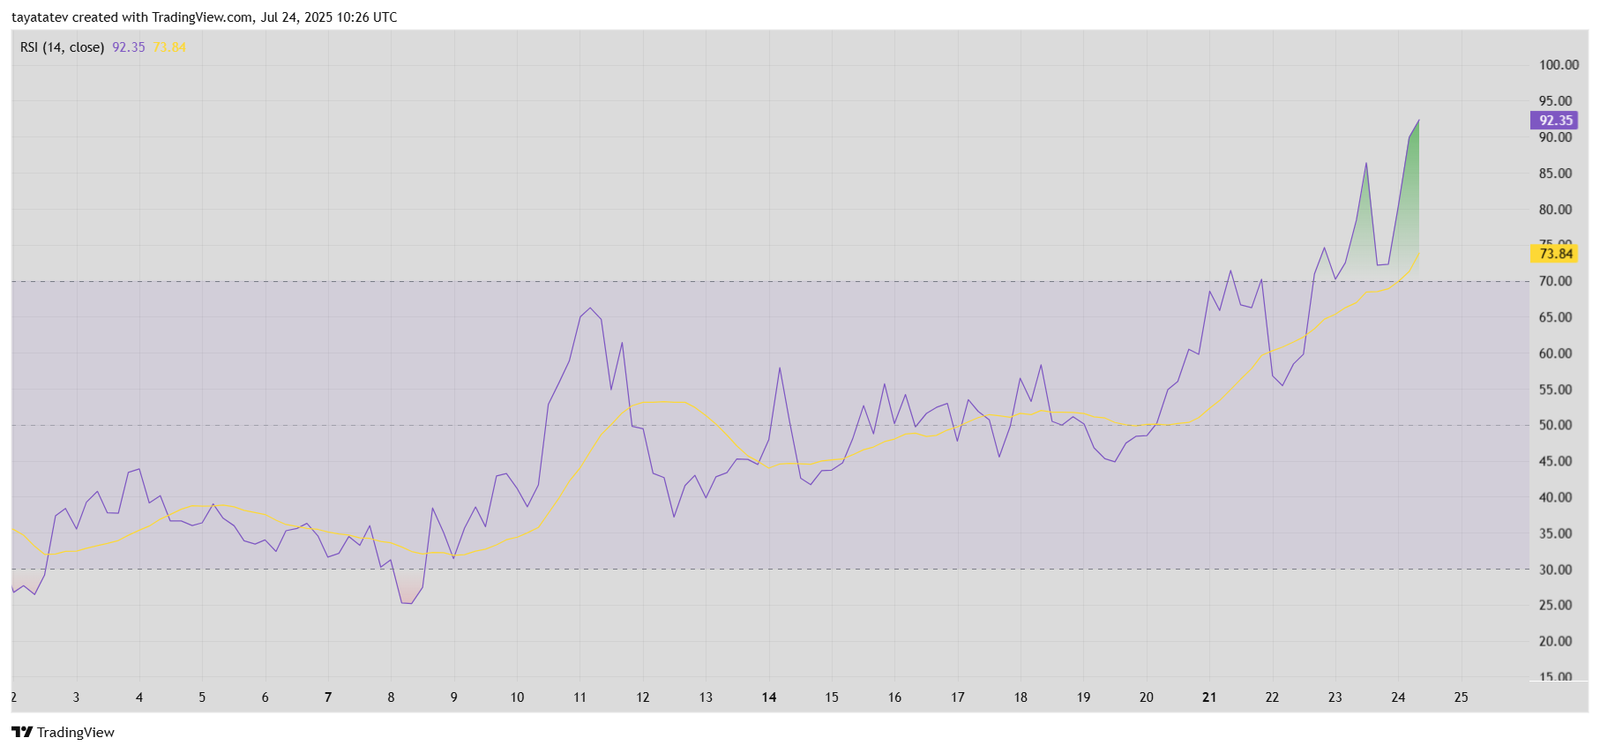
The Relative Strength Index (RSI) for NEWT has entered extreme overbought territory, signaling strong momentum but also potential exhaustion. As of July 24, the 14-period RSI stands at 92.35, far above the standard 70 threshold. The last reading of the RSI moving average line is 73.84.
This surge in RSI reflects the rapid price increase over the past few sessions. The steep climb began around July 21, accelerating through July 24 as the RSI jumped from below 60 to over 90.
Typically, RSI values above 70 suggest that an asset may be overbought, meaning the buying pressure could slow down or reverse temporarily. However, in strong rallies, RSI can remain elevated for longer periods before any correction appears.
In this case, the RSI movement matches the recent breakout in price and confirms intense bullish sentiment. The vertical slope of the current RSI line highlights aggressive accumulation, although traders might now watch for signs of consolidation.
SMI Chart Shows Renewed Upward Momentum for NEWT
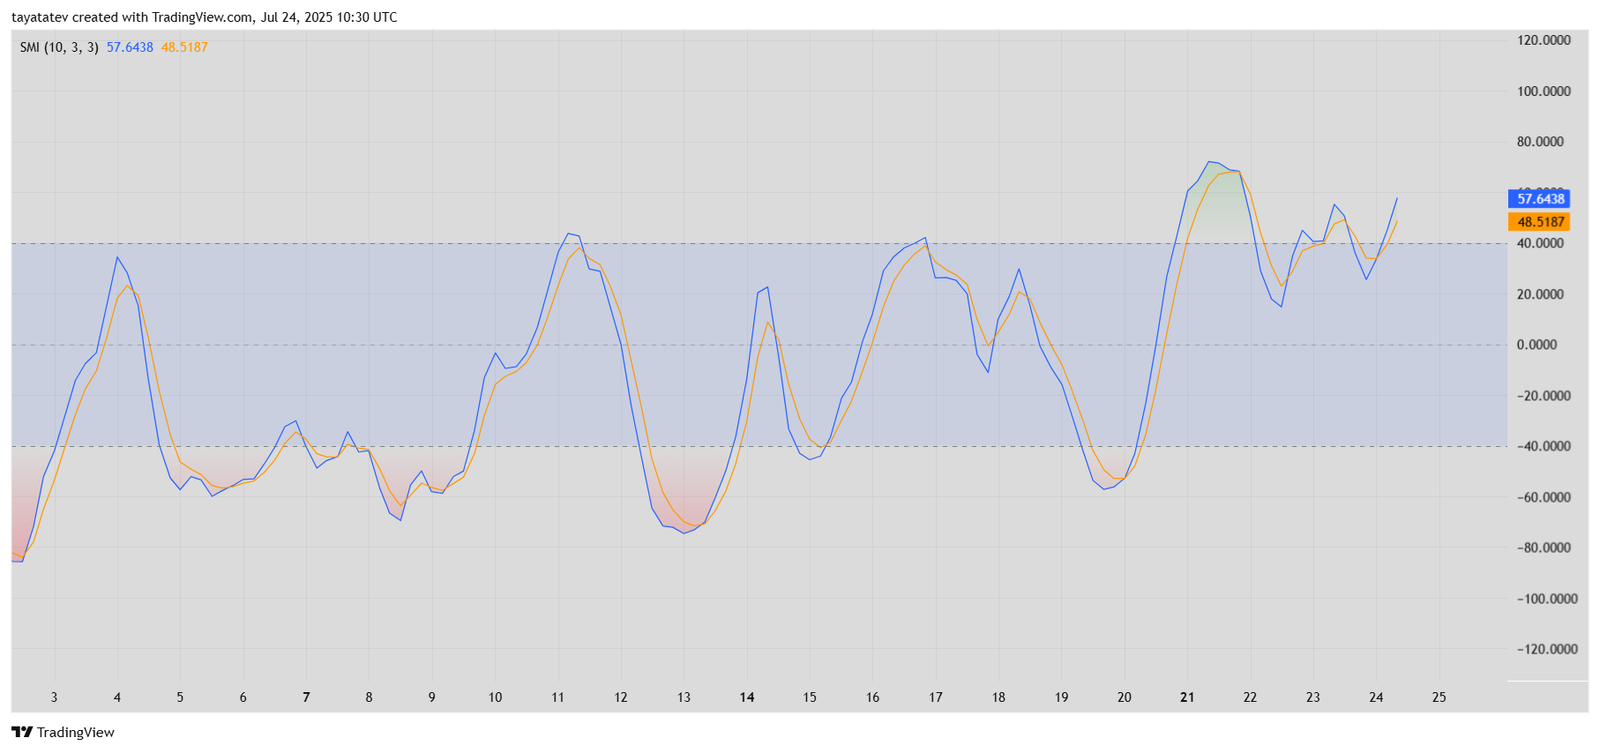
The Stochastic Momentum Index (SMI) chart for NEWT indicates a new bullish swing is forming. As of July 24, the SMI line (blue) is at 57.64, while the signal line (orange) follows at 48.52. This positive crossover shows that momentum is again shifting upward after a brief pause.
Stochastic Momentum Index Chart. Source: TradingView
The SMI reflects both direction and strength of market movement. Over the past two days, the indicator moved from negative to positive territory, bouncing off the midline near zero. The latest crossover confirms buyers are regaining control after recent consolidation.
This renewed rise in the SMI comes after a larger bullish wave earlier in July. The current position near the 60 level keeps the token in moderately bullish territory, but not yet overbought. If momentum continues, the SMI may push toward its previous peak near 80.
The SMI often leads price action in short-term trading. Its current slope supports the strong upward movement seen in price and volume, suggesting the rally may still have room to continue.
Tatev Avetisyan is a Markets Writer and Analyst at CoinChapter, covering cryptocurrency markets, policy, and regulation. With over seven years of experience in business and marketing development, she has spent the past two years specializing in digital assets and has authored more than 2,000 articles on crypto markets and regulatory developments.She contributes as a guest writer to leading industry publications and is a prominent Web3 advocate in Armenia through Web3Armenia. Her work reflects a broader focus on artificial intelligence and Web3 technologies.
Tatev maintains a diversified crypto portfolio, with Bitcoin as her primary holding above CoinChapter’s $1,000 disclosure threshold.