
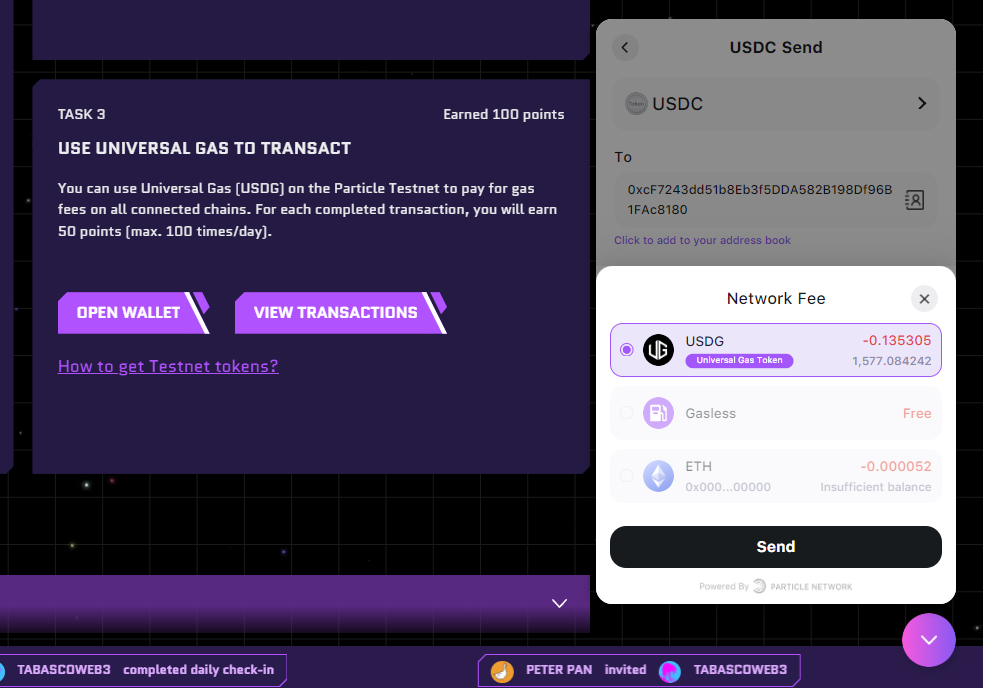
Particle Network continues to simplify cross-chain interactions by expanding its Universal Accounts system. These smart-contract wallets let users maintain a single address and balance across multiple chains. Furthermore, they enable users to execute transactions with one signature by routing and aggregating funds atomically across platforms. They even allow gas payments in any token via the Universal Gas feature. Transitioning from testnet into production, the system now supports Ethereum L2s, Solana, and other networks .
Moreover, technical upgrades enhance the user experience:
Integration of Everclear and deployment of UniversalX V2 support efficient liquidity rebalancing within Universal Accounts.
Developers can integrate the Universal SDK to launch Universal Accounts via one EIP‑1193 call, enabling multi-step transactions across chains with atomic settlement.
Ecosystem Growth: Adoption, Activity, and App Expansion
Particle Network reported strong metrics in Q1 2025. Universal Accounts reached 110,900, a 558% increase quarter-over-quarter. Daily transactions averaged 27,100—an 806% surge—primarily driven by activity on Arbitrum, Base, and Optimism networks.
The network’s DEX, UniversalX, recorded an average daily trading volume of $5.9 million in Q1, marking a 15,154% increase from the previous quarter . Meanwhile, over 90 third-party projects plan to integrate Universal Accounts, with early adopters including Singularity Finance, Taker Protocol, Galaxis, Trikon, and Tanssi.
Particle Network’s Universal Accounts, Universal Gas, and Universal Liquidity are scaling effectively through technical enhancements, broader chain support, and rapid ecosystem adoption. The launch of UniversalX V2 and Everclear further strengthens infrastructure. As adoption grows, Particle is positioning itself as a cornerstone of Web3’s cross-chain future.
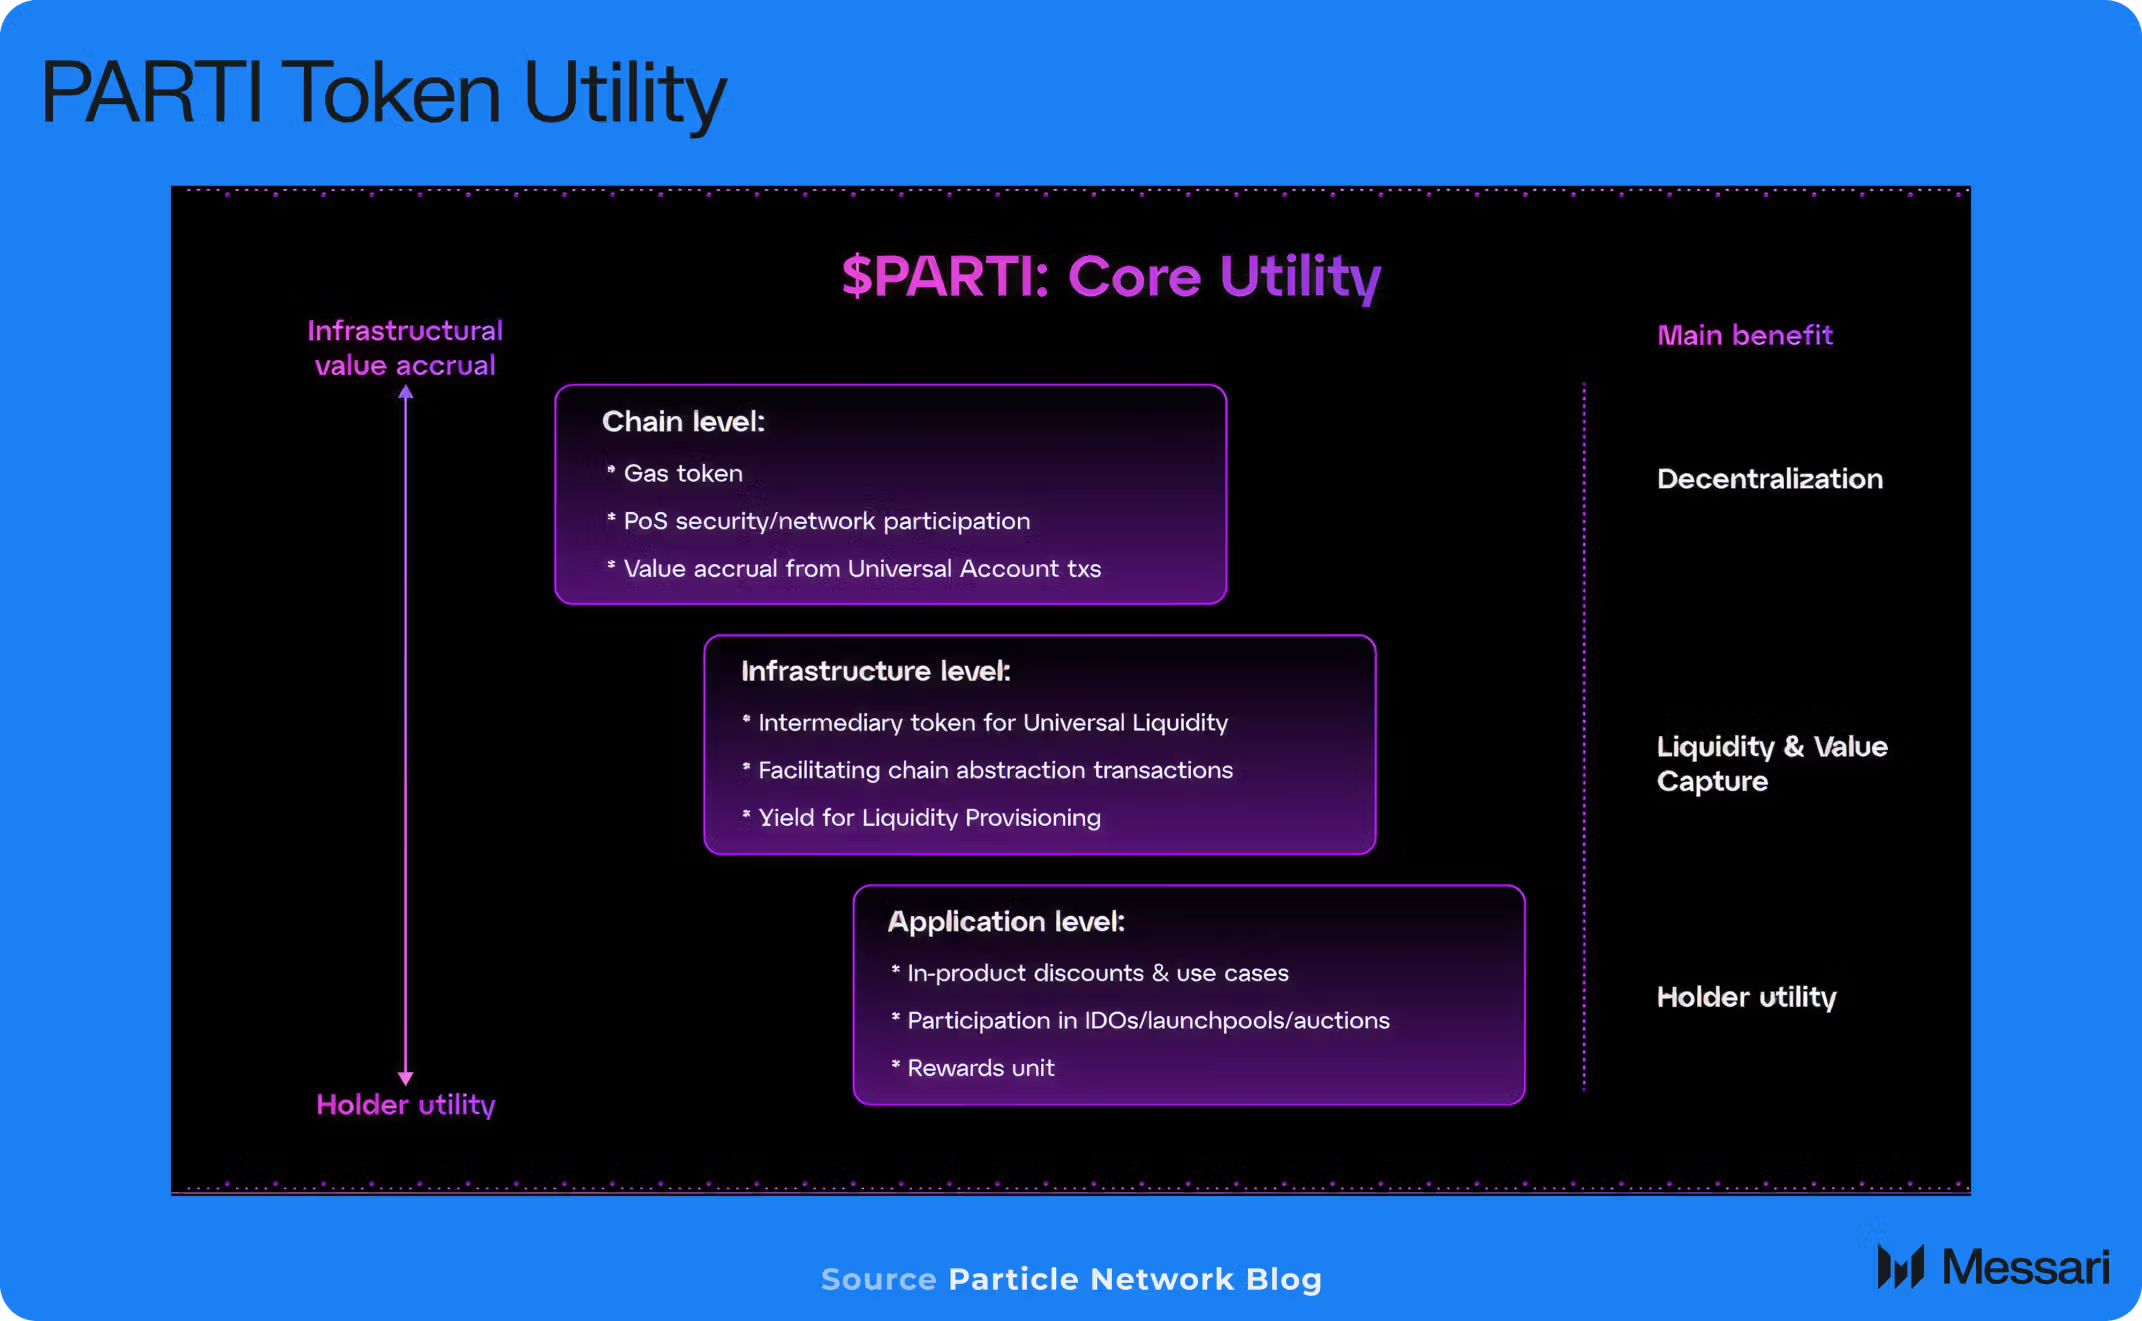
PARTI Token Launch Draws Massive Demand
On March 25, 2025, Particle Network launched its native token, PARTI, following a highly oversubscribed Binance Initial DEX Offering (IDO). The IDO raised $1.3 million and was oversubscribed by 160 times, signaling strong early demand.
During the token generation event (TGE), 23.3% of the total 1 billion PARTI supply entered circulation. This included 9% distributed to the community through an airdrop. Within the first 24 hours, PARTI recorded over $1 billion in spot trading volume across major exchanges.
The token debuted on platforms including Binance, OKX, Bybit, MEXC, Bitget, Gate.io, and others, gaining immediate global exposure.
PARTI Price Forms Descending Channel, Eyes 42% Rebound Toward $0.249
On July 4, 2025, the 4-hour PARTI/USDT (Tether) chart on Binance revealed a descending channel pattern. This formation stretches from mid-June to early July and is marked by two downward-sloping red trendlines. The current price stands at $0.1752, trading near the lower boundary of the channel.
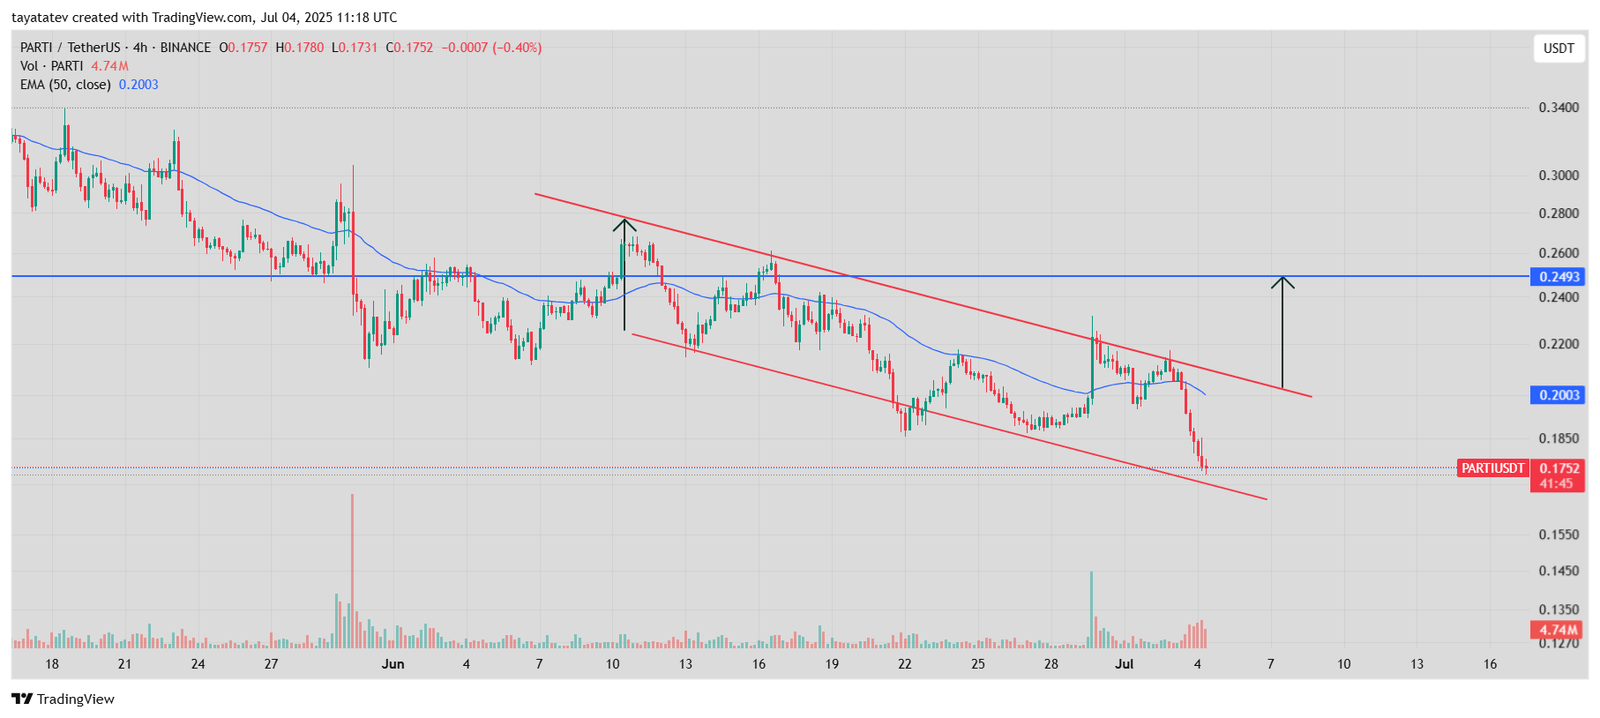
A descending channel—also known as a falling channel—forms when a token creates lower highs and lower lows within parallel downward lines. While it signals a bearish trend in the short term, it often acts as a bullish reversal pattern when price breaks above the upper trendline. Traders use this structure to anticipate a potential upward breakout once selling pressure weakens and buyers regain control.
In this chart, trading volume reached 4.74 million PARTI, suggesting renewed buyer interest near the bottom of the pattern. If the price breaks above the upper boundary of the channel, it could spark a move to $0.2493. That would mark a 42% gain from the current price. This level matches the horizontal resistance from early June, where the price previously rejected.
The chart also shows the 50-period Exponential Moving Average (EMA) hovering around $0.2003. The EMA still trends above the current price, confirming a bearish phase. However, a strong candle close above the upper trendline and EMA could signal a reversal, setting the stage for a run toward $0.2493.
If confirmed, this breakout from the descending channel could mark a shift in momentum, turning recent weakness into a mid-term bullish setup.
RSI Dips Into Oversold Zone, Reinforces Reversal Case for PARTI
On July 4, 2025, the 4-hour Relative Strength Index (RSI) for PARTI/USDT fell to 27.59, sliding below the critical 30-level threshold that typically signals an oversold condition. This suggests that the token may be undervalued in the short term and could be preparing for a potential reversal.
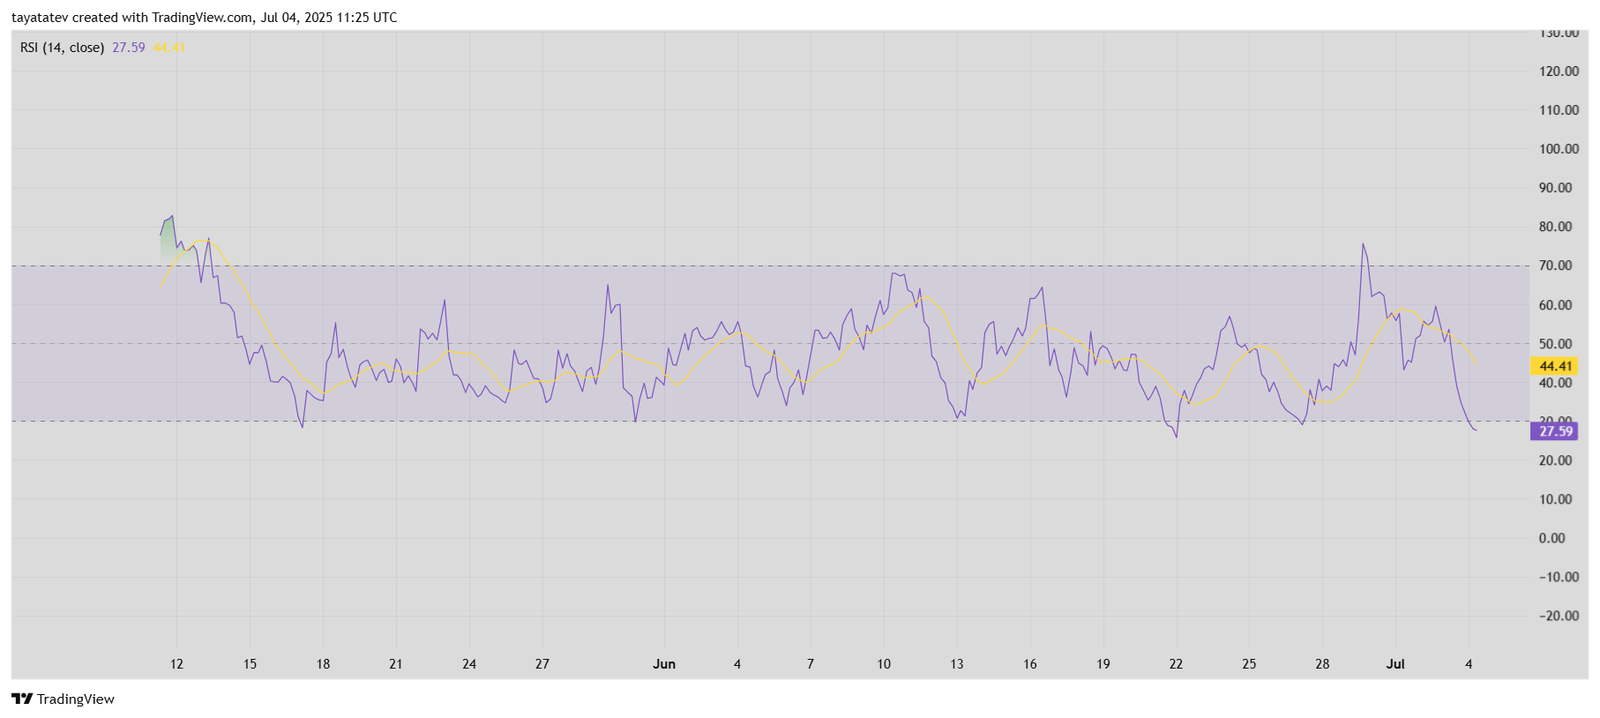
The Relative Strength Index (RSI) is a momentum indicator that measures the speed and change of price movements over a set period—here, 14 periods. The scale runs from 0 to 100, with values below 30 indicating oversold conditions and values above 70 signaling overbought conditions. Traders often use RSI readings to spot possible trend reversals or confirm breakout setups.
In this case, the RSI line (purple) dropped sharply, diverging from the yellow moving average, which currently reads 44.41. This divergence points to increased bearish pressure but also hints that the token might be due for a bounce, especially when considered alongside the descending channel pattern seen on the price chart.
If RSI rebounds above 30 while price holds or climbs from the lower boundary of the channel, it could validate the bullish breakout scenario and support the potential 42% move toward $0.2493.
Together, the RSI reading and the descending channel setup create a strong technical argument for a short-term bullish reversal in PARTI.
MACD Signals Growing Bearish Pressure But Eyes Possible Reversal Setup
As of July 4, 2025, the 4-hour MACD (Moving Average Convergence Divergence) chart for PARTI/USDT shows early signs of short-term weakness, with a possible reversal ahead. The MACD line (blue) has crossed below both the signal line (orange) and the zero line, signaling bearish momentum. Current MACD values are –0.0038 (MACD line) and –0.0026 (signal line), while the histogram has turned red, confirming a downward trend.
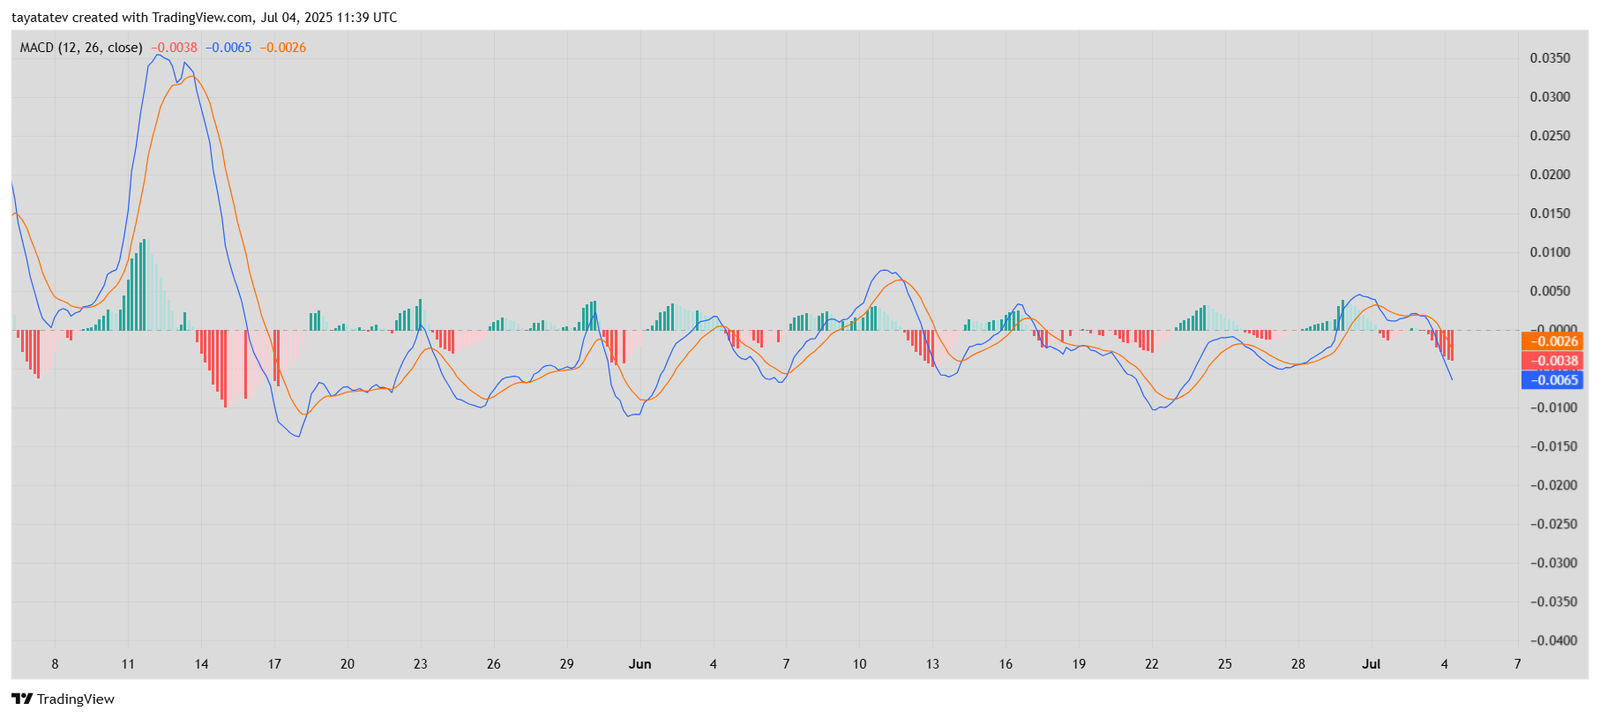
The MACD indicator compares two exponential moving averages—12-period and 26-period—and plots the difference as the MACD line. When this line crosses below the signal line, it signals selling pressure. The histogram visualizes this momentum, with red bars showing acceleration to the downside.
However, while the current MACD values confirm bearish movement, they remain shallow compared to previous downward cycles. This suggests that downside momentum may be limited. If the histogram starts to shrink and the MACD line flattens, it could signal an early stage of reversal—especially if price action confirms a breakout from the descending channel.
In the context of other indicators, like the Relative Strength Index (RSI) sitting at 27.59, the MACD now adds another layer suggesting that the token may be approaching a bottom. A bullish crossover between the MACD and signal line in the coming sessions could further validate a move toward the $0.2493 upside target.
