
Large volumes of Pudgy Penguins’ PENGU tokens are flowing from the project’s deployment address to centralized exchanges (CEXs), raising concerns amid a sharp market rally.
Over $66M in PENGU Sent to Exchanges
On July 28, blockchain analyst EmberCN, citing Arkham Intelligence data, reported that more than 206.9 million PENGU tokens, worth approximately $8.91 million, were transferred to various exchanges within 24 hours. He added that this forms part of a broader pattern observed over the past month.

According to EmberCN, the PENGU team has moved over 2 billion tokens, valued at roughly $66.6 million, to CEXs in the last 30 days. Such transfers are often viewed as preparation for selling and can signal potential liquidation.
Despite the outflows, PENGU’s price continues to climb. CryptoSlate data shows the token trading at $0.04278, up 3.3% in 24 hours, 17% over the past week, and nearly 230% in the last month.
Security Warnings Amid New Scam Wave
As PENGU’s price surged, scammers launched new phishing attacks targeting token holders. On July 27, Beau, Pudgy Penguins’ head of security, warned that fraudsters are using “dust” tactics. These involve sending small amounts of PENGU tokens to random wallets using vanity address names disguised as fake website URLs.

Beau explained that victims who search these vanity names on Solscan risk clicking phishing links mimicking Pudgy Penguins’ branding. Once connected, malicious transactions drain their wallets.
He emphasized that no official PENGU airdrop or claim is currently active. Additionally, Beau flagged counterfeit PENGU tokens designed as honeypots that trap users during swaps and steal funds.
These scams highlight increasing fraud risks during market rallies. Beau urged users to verify token sources, avoid unsolicited airdrops, and stay cautious when interacting with unknown links.
PENGU Forms Bullish Pennant with 274% Upside Potential
The PENGU/USDT chart created on August 1, 2025, shows that the token is forming a bullish pennant pattern, which is a continuation pattern that appears after a strong upward move and signals potential for further gains if confirmed. Currently trading near $0.0339, PENGU is consolidating between converging trendlines, while its 50-period Exponential Moving Average (EMA) stands at $0.0375. This pattern typically resolves upward when buying pressure breaks the upper trendline, continuing the prior rally.
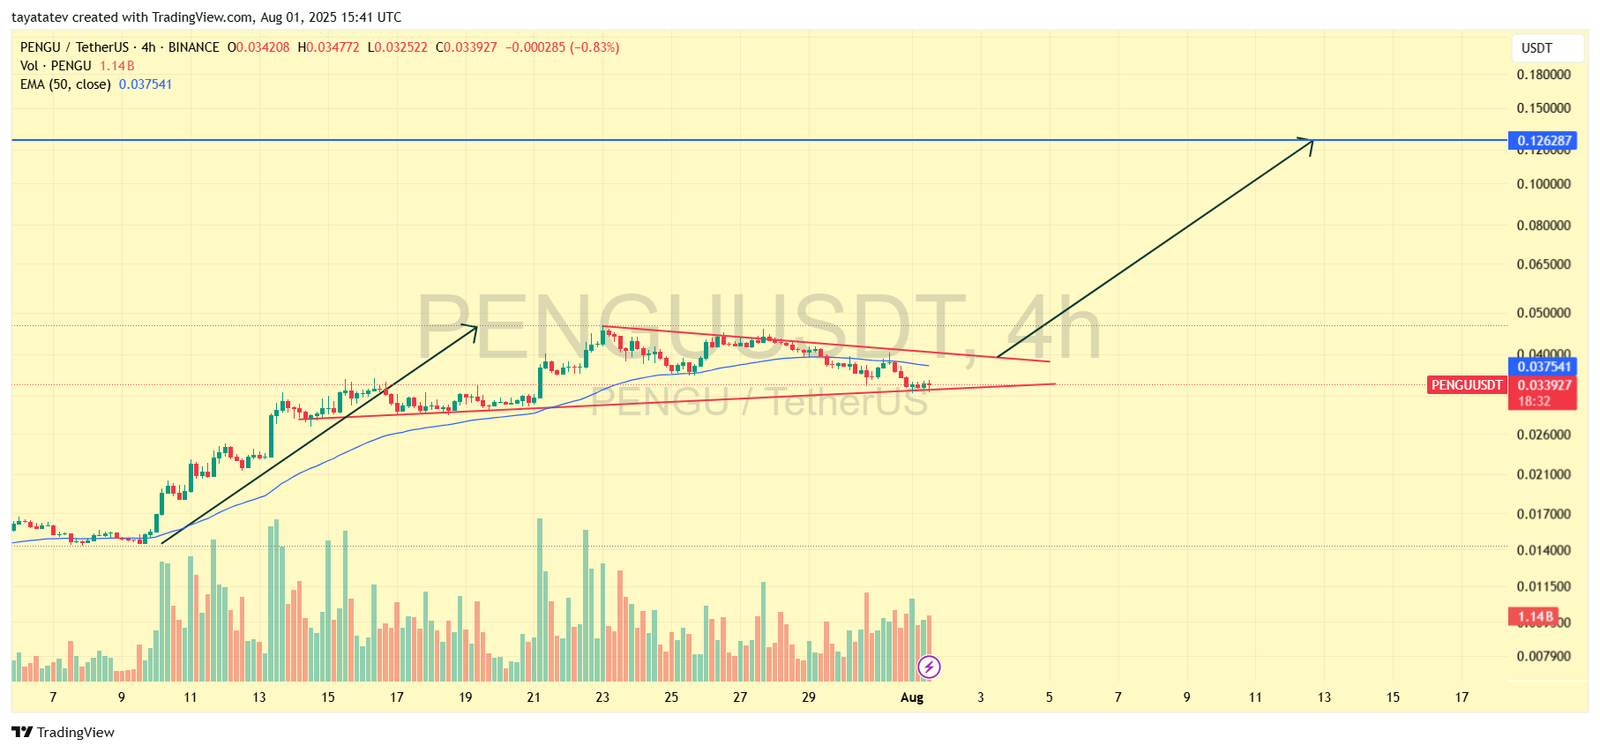
If confirmed, this breakout could push PENGU’s price up by 274 percent from its current level, targeting approximately $0.1262. Trading volume has declined during consolidation, which supports the pennant’s structure. A surge in volume accompanying an upward breakout would likely validate the move and trigger strong bullish momentum.
However, if the price fails to hold above the lower trendline, it may weaken the setup. As of now, the chart structure, combined with recent price history, indicates that buyers are preparing for a potential breakout aligned with the ongoing trend.
PENGU MACD Signals Bearish Momentum Shift
The PENGU/USDT Moving Average Convergence Divergence (MACD) chart created on August 1, 2025, shows a clear bearish signal. The MACD line, represented in blue, has crossed below the signal line, shown in orange, while the histogram has extended into negative territory. This movement indicates that bearish momentum is increasing, and selling pressure is dominating the market.

The negative crossover aligns with declining price action and reduced buying volume, suggesting that traders are pulling back. Additionally, the widening gap between the MACD and signal line reinforces the ongoing downtrend. While this indicator currently supports a bearish short-term view, it also highlights oversold conditions developing, which could eventually set up for a potential reversal if market demand returns.
For now, the MACD confirms that momentum remains weak, and any bullish recovery will likely require a strong uptick in buying interest to reverse this signal.
PENGU RSI Shows Oversold Conditions with Potential Rebound Setup
The PENGU/USDT Relative Strength Index (RSI) chart created on August 1, 2025, shows the RSI at 35.47, nearing the oversold threshold of 30. This position indicates weakening selling pressure and suggests that the token may soon approach a reversal point if buyers return.

The RSI has trended downward in recent sessions, reflecting consistent price declines and sustained bearish momentum. However, being close to oversold territory often signals that sellers are losing control, creating conditions for a potential rebound.
The moving average of the RSI, currently at 37.17, remains just above the main RSI line, reinforcing short-term bearish control. A crossover above this moving average would strengthen the case for a bullish shift. For now, the RSI highlights that while bearish momentum persists, the market is edging closer to levels where a technical bounce could emerge.
PENGU Balance of Power Signals Weak Market Control
The PENGU/USDT Balance of Power (BOP) chart created on August 1, 2025, shows a current reading of -0.08, indicating that sellers hold slight control over the market. The BOP fluctuates sharply around the neutral line, which reflects indecision between buyers and sellers.

This near-neutral position suggests that neither side is strongly dominating, but the negative value highlights marginal bearish influence. The frequent shifts above and below the zero line point to volatile trading conditions without a clear directional trend.
If the BOP moves deeper into negative territory, it would confirm stronger selling pressure and reinforce ongoing weakness. Conversely, a sustained shift above zero could indicate renewed buying momentum and strengthen the case for a bullish recovery. At present, the indicator shows a fragile balance tilted slightly in favor of sellers.
