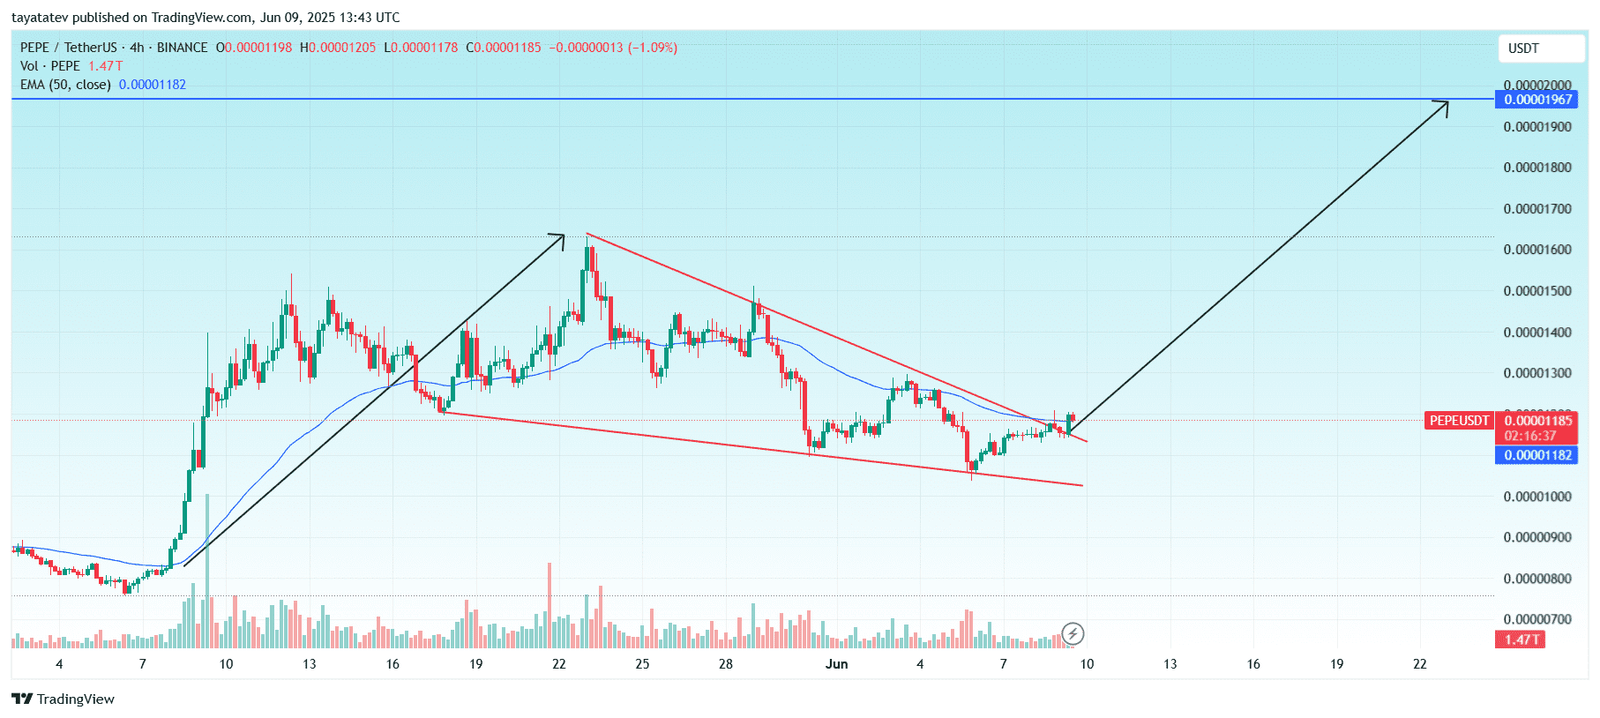
On June 9, 2025, the PEPE/USDT 4-hour chart confirmed a falling wedge pattern. The price broke out of the descending resistance line, which had formed after a sustained downtrend from May 22. The breakout occurred near the $0.00001185 level, with trading volume showing moderate activity at 1.47 trillion PEPE.
A falling wedge is a bullish reversal chart pattern formed by converging downward trendlines and often signals a potential upward breakout.
If the pattern confirms, PEPE could rally 66% from the current price of $0.00001185 to the projected target of $0.00001967. This target is measured by adding the wedge’s maximum height to the breakout point.
Trading volume has remained steady, supporting the breakout’s validity. The 50-period Exponential Moving Average (EMA), now at $0.00001182, aligns with the breakout zone and acts as dynamic support. PEPE has closed multiple candles above this EMA, further strengthening the bullish structure.
The wedge pattern began forming after a steep rise between June 7–21, followed by a correction within two downward-sloping red lines. This retracement shaped the wedge, which narrowed toward early June. The breakout took place just as the price breached the wedge’s upper boundary and climbed above the EMA.
If PEPE holds above the $0.00001180–$0.00001190 area, momentum may accelerate toward the $0.00001967 target in the coming sessions.
PEPE MACD Flashes Bullish Crossover Ahead of Wedge Breakout
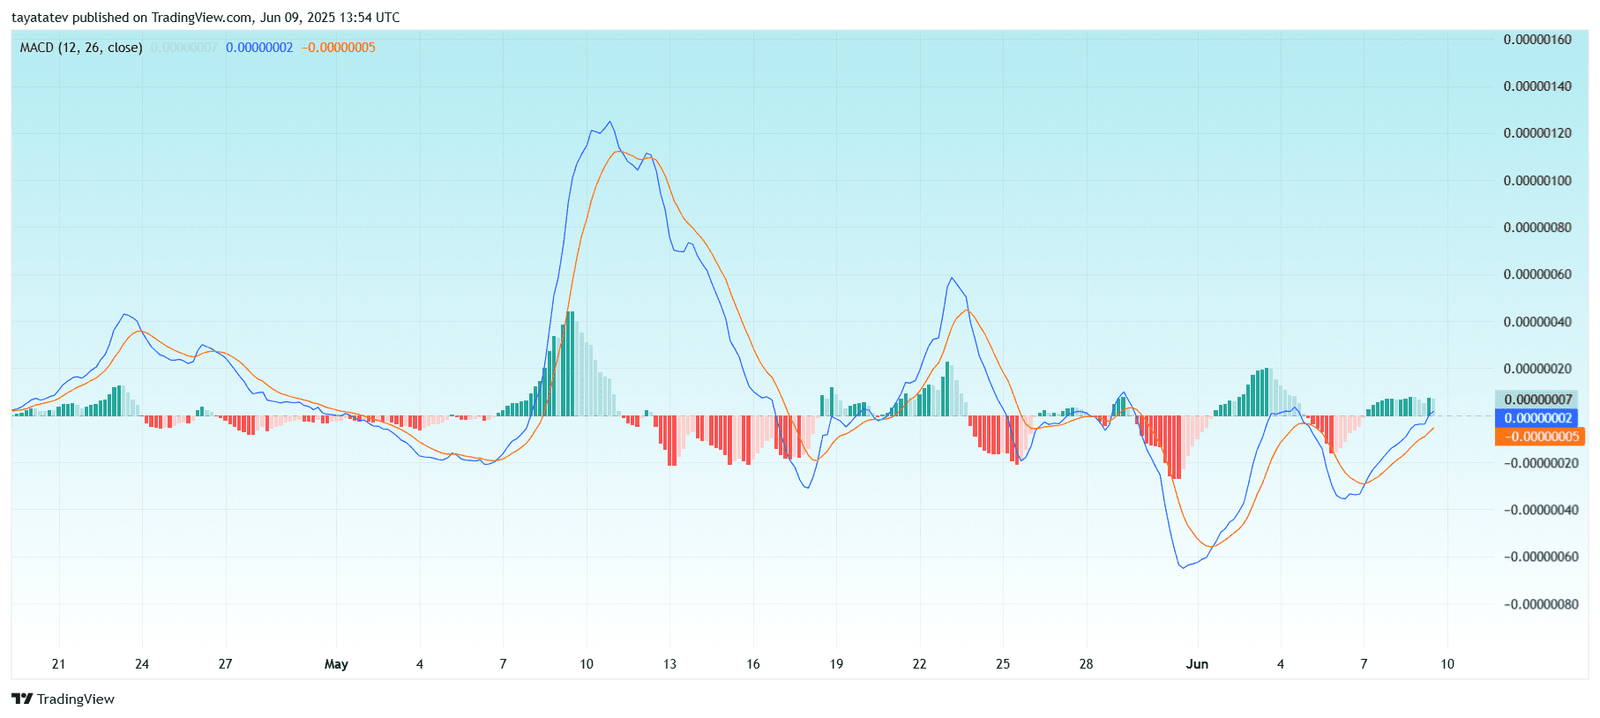
The Moving Average Convergence Divergence (MACD) indicator for PEPE/USDT on the 4-hour chart displayed a bullish crossover on June 9, 2025. The MACD line (blue) crossed above the signal line (orange), confirming upward momentum.
MACD (Moving Average Convergence Divergence) is a trend-following momentum indicator that shows the relationship between two moving averages of a price.
The MACD histogram flipped from red to green, showing growing bullish momentum. The histogram bars are increasing in height, which signals strengthening price movement. The last crossover occurred near the zero line, which increases its reliability.
This bullish crossover aligns with the falling wedge breakout observed earlier on the price chart. It confirms the potential for continuation toward the $0.00001967 target. Momentum is clearly shifting in favor of buyers.
Since June 7, the MACD has steadily risen from a low near -0.00000006 to +0.00000007, reflecting a sustained momentum shift. If the trend continues, further upside pressure may push PEPE beyond its next resistance levels.
RSI Confirms Bullish Momentum on June 9
The Relative Strength Index (RSI) for PEPE/USDT on the 4-hour chart crossed above the neutral 50 level on June 9, 2025. The RSI now reads 53.81, while its 14-period moving average holds at 50.22. This shift signals growing strength in price momentum. RSI (Relative Strength Index) is a technical indicator that measures the speed and magnitude of recent price changes to evaluate overbought or oversold conditions.
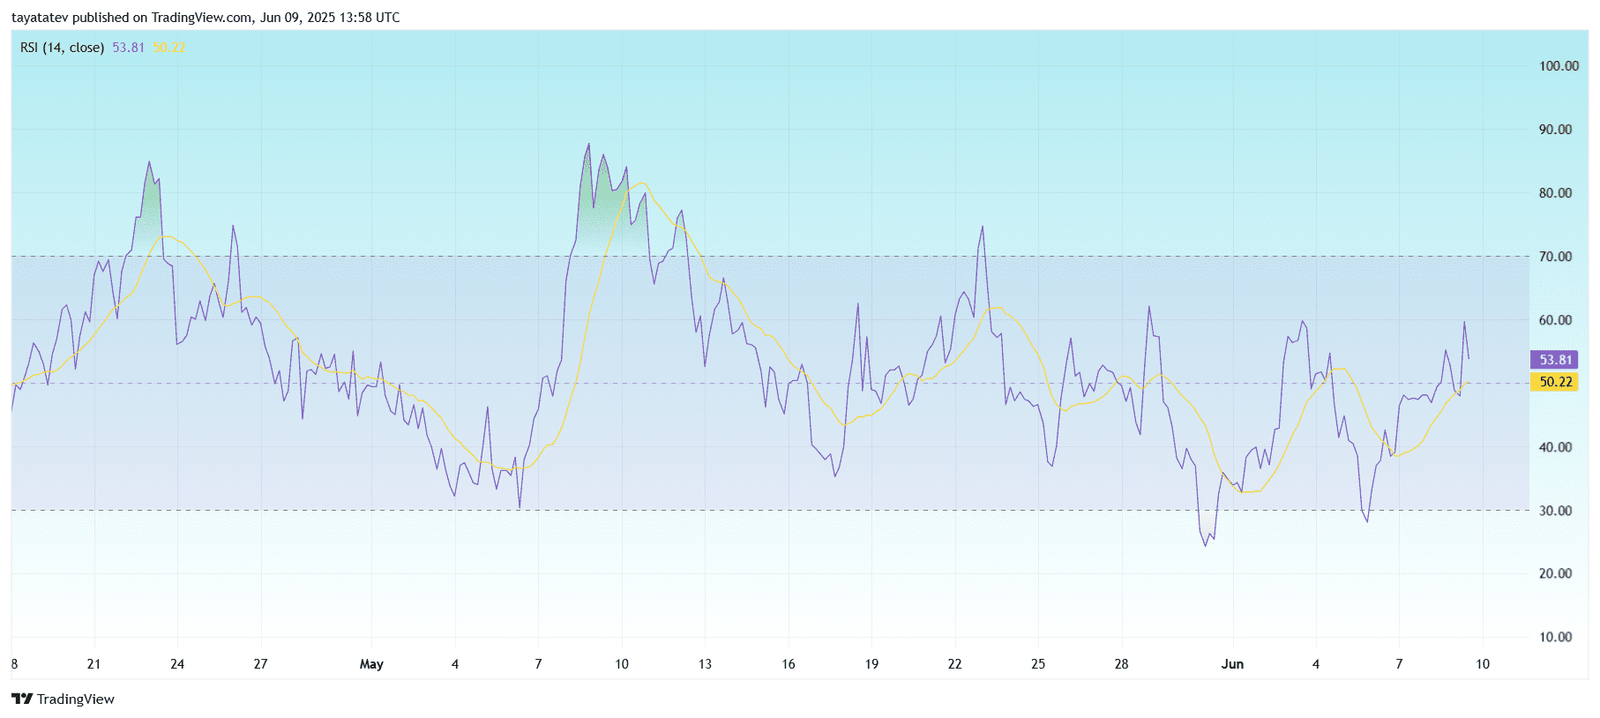
Since June 6, the RSI climbed steadily from a low near 25. This upward move confirms the bullish reversal, in line with the falling wedge breakout and MACD crossover. The RSI’s breakout above its average also reinforces the trend shift from bearish to bullish.
With the RSI still well below the overbought threshold of 70, there is room for further upside before short-term exhaustion. The indicator currently supports continuation toward the projected target of $0.00001967.
PEPE Indicators Align: DMI, RSI, MACD Support 66% Rally
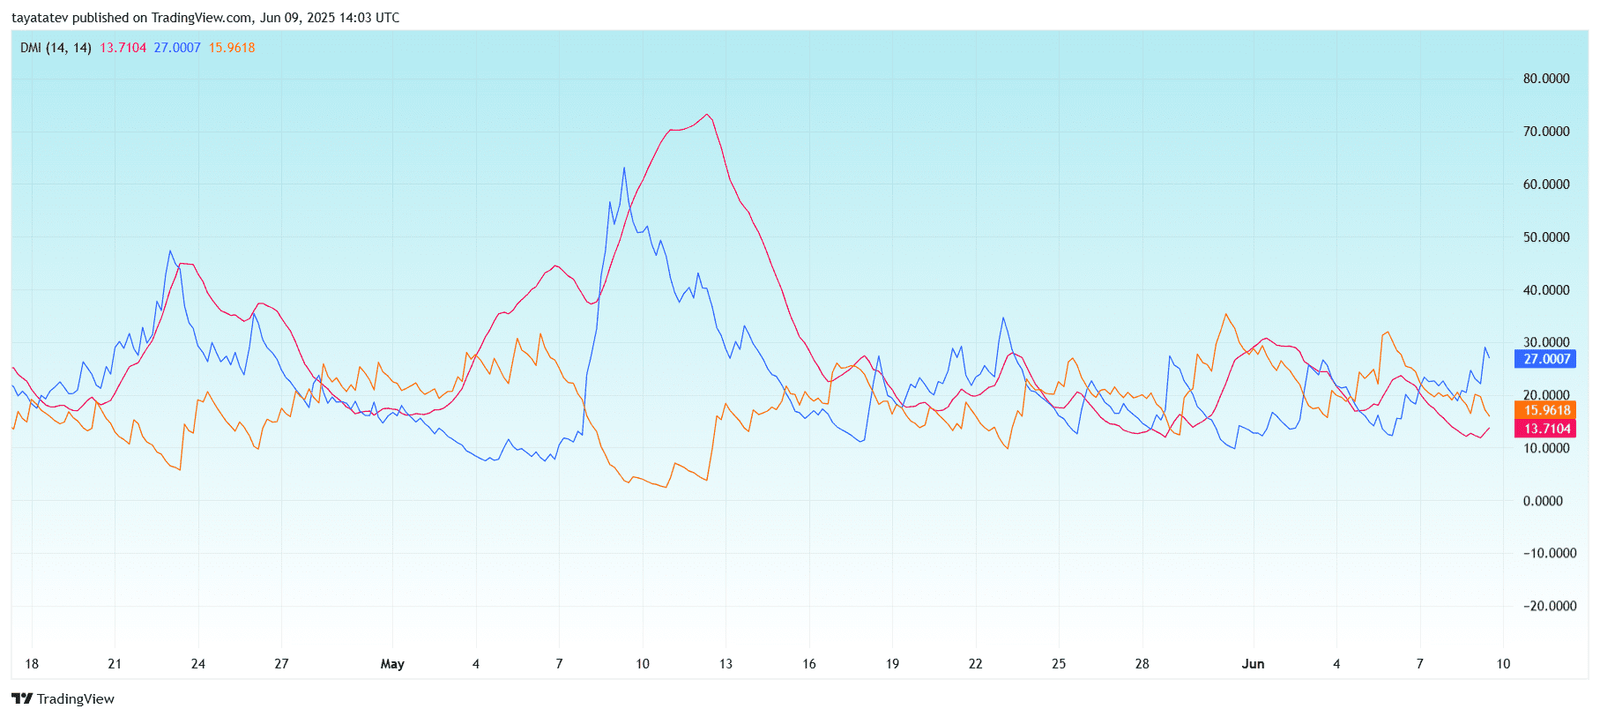
On June 9, 2025, multiple indicators on the PEPE/USDT 4-hour chart confirmed a shift toward bullish momentum. The Directional Movement Index (DMI) shows the +DI line (27.00) rising above the -DI line (13.71), confirming a bullish crossover. The Average Directional Index (ADX) stands at 15.96, signaling that a trend is forming but not yet strong.
At the same time, the Relative Strength Index (RSI) climbed above the neutral 50 level, reaching 53.81. This shows improving strength in price movement after bouncing from oversold conditions earlier in June. The RSI also broke above its moving average (50.22), confirming upward momentum.
The Moving Average Convergence Divergence (MACD) also turned bullish. The MACD line crossed above the signal line near the zero axis, and the histogram turned green. Momentum continues rising steadily since June 7.
These three signals—DMI crossover, RSI recovery, and MACD bullish turn—align with the falling wedge breakout pattern already visible on the price chart. If momentum continues, the price may rise 66% from the current level of $0.00001185 to the projected target of $0.00001967.
Whale Accumulation Sparks Bullish Momentum in Pepe Coin
Whale wallets have resumed accumulating Pepe Coin following a breakout from a descending channel. Data from Whales_Crypto_Trading confirms this shift, which often signals the early stages of a sustained uptrend.

According to Spot On Chain, one major whale recently bought 154.29 billion PEPE worth $1.7 million. This address now holds 1.38 trillion PEPE, showing an unrealized profit of over $12 million—a 196% increase from entry.
An analyst noted, “Volume during the breakout was substantial—clear evidence that larger players are back. This isn’t retail-driven hype; it’s calculated accumulation.”
The price of PEPE is now hovering near $0.00001143, after bouncing nearly 7% from a recent low of $0.00001052. This recovery confirms that the $0.00001050–$0.00001060 range is acting as a strong demand zone. The bounce from this support zone adds strength to the bullish outlook and suggests renewed interest from long-term holders.
