
On June 5, 2025, PEPE/USDT formed a bullish falling wedge pattern on the 4-hour chart, signaling a potential breakout.
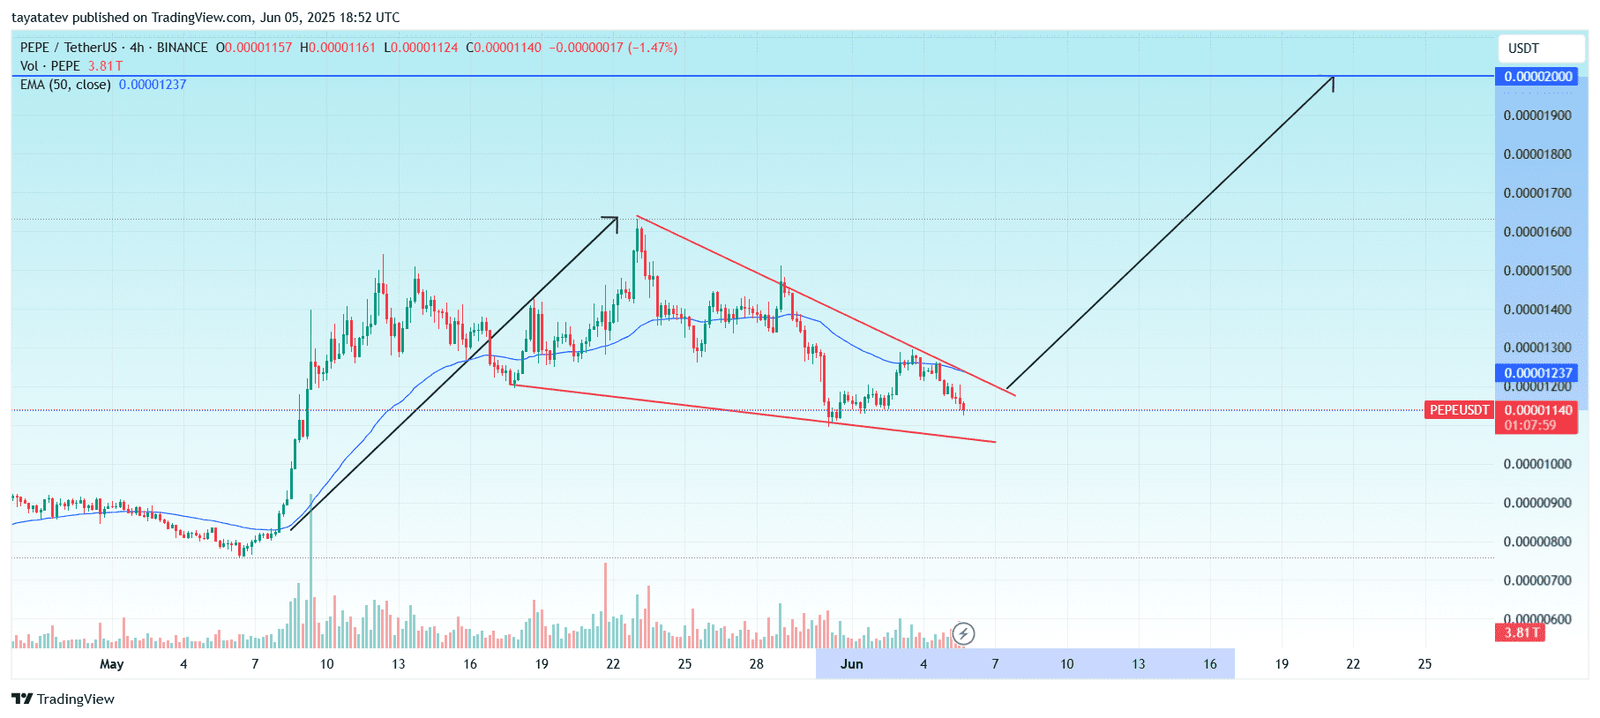
A bullish falling wedge occurs when price declines between two converging downward trendlines. It usually indicates weakening selling pressure and a possible bullish reversal once the price breaks above the wedge’s upper resistance line.
At the time of formation, PEPE traded at $0.00001140. The projected breakout target stands near $0.00002000, marking a potential 75% price increase if confirmed.
The price remains below the 50-period Exponential Moving Average (EMA), which acts as dynamic resistance at $0.00001237. A decisive breakout above both the EMA and the wedge resistance line would activate the bullish setup.
Volume has declined during the wedge formation, consistent with pattern expectations. A surge in volume upon breakout would validate the bullish reversal and support the target.
PEPE/USDT Bulls Take Lead, But Trend Still Weak, DMI Shows
On June 5, 2025, the Directional Movement Index (DMI) on the 4-hour PEPE/USDT chart showed signs of early bullish momentum, though without strong confirmation. The positive directional indicator (+DI) printed 23.20, rising above the negative directional indicator (–DI), which stood at 15.09. This positioning signals a slight advantage for buyers.

However, the Average Directional Index (ADX) came in at 18.23, staying well below the key 25 threshold that defines a strong trend. This suggests the market remains in a weak or indecisive state despite bullish positioning. In recent sessions, the +DI and –DI moved closely together, confirming low volatility and consolidation. That aligns with the falling wedge pattern spotted earlier on the price chart.
For the bullish breakout scenario to activate, the ADX would need to rise and confirm growing momentum. Until then, the trend direction leans positive but lacks enough strength for validation.
PEPE/USDT RSI Dips Toward Oversold Zone, Momentum Weakens
The 4-hour Relative Strength Index (RSI) for PEPE/USDT dropped to 35.69, moving closer to the oversold threshold of 30. The RSI moving average stands higher at 47.43, indicating recent downward pressure.
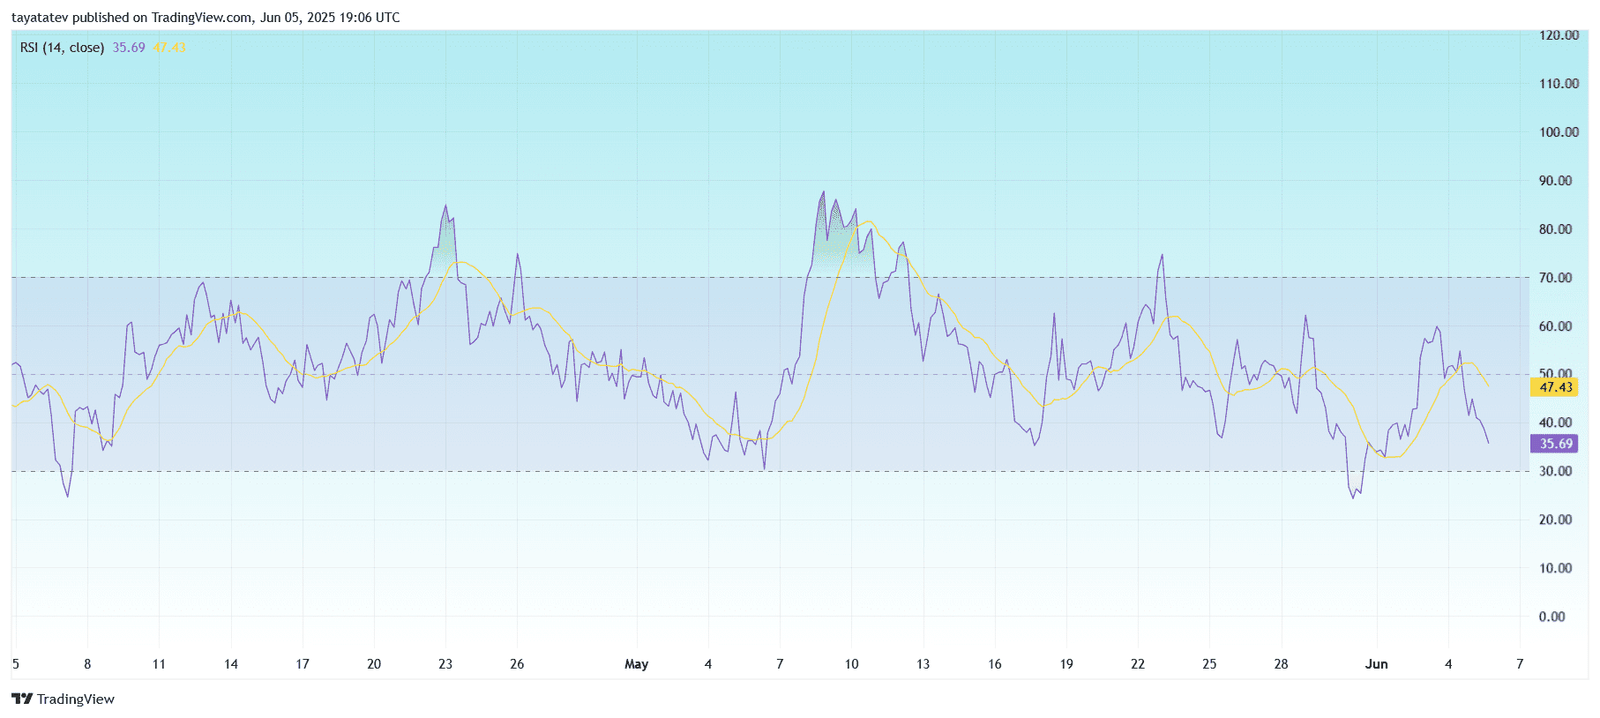
The gap between the RSI and its average suggests weakening short-term momentum. Price has struggled to sustain upward moves in recent sessions, and the RSI has failed to break above the midline (50), signaling persistent bearish sentiment.
While the RSI has not yet entered the oversold zone, its current level reflects reduced buying interest and growing downside risk. If it continues to fall below 30, that may trigger a reaction from buyers seeking a lower entry point.
