
PEPE Coin is attempting to reclaim bullish momentum as mid-2025 approaches, with technical indicators indicating possible continuation following a broad market correction. The Ethereum-based memecoin has rebounded modestly after falling to the $0.00001100 level last week.
Rounded Retest Pattern Emerges on Higher Timeframes
A recent chart review by technical analyst Jackis suggests that PEPE has formed a rounded retest on the 2-day chart. This is a setup that historically aligns with trend continuation. According to the breakdown, the token broke through resistance after forming a base and is now consolidating above that zone. The rounded nature of the retest suggests that the pullback may be part of a healthy accumulation process, rather than a trend reversal.
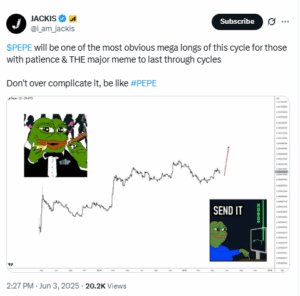
Jackis labeled the structure a “mega long,” a term often used among traders to describe conviction in a multi-week upside potential. However, any continuation from here will depend on broader market stability and volume expansion.
Furthermore, Speculative projections continue to circulate online. This included those from trader DexGemsReal, who pointed to an ascending triangle pattern on higher timeframes and floated a $30 billion market cap target.

While such formations often carry bullish implications, their reliability is dependent on clear volume confirmation. This is something PEPE has not yet demonstrated at current levels.
Memecoins, by nature, trade less on fundamentals and more on social momentum, sentiment cycles, and liquidity. Without a sharp uptick in trading activity, aggressive forecasts remain aspirational.
Can PEPE Sustain the Rebound?
PEPE to USD is currently trading at $0.00001242, recovering 9.69% in the last 24 hours but still down 11.34% over the past week. Price action remains range-bound between $0.00001239 and $0.00001252 on the 4-hour chart. The Relative Strength Index (RSI) has stabilized at 51.77—just above the midline—suggesting neutral momentum.
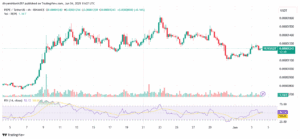
This recovery follows a sharp decline to $0.00001100, which has now established itself as the near-term support zone. Volume has remained relatively stable, with no significant spikes, implying a period of quiet accumulation rather than speculative breakout attempts. For bulls to regain full control, PEPE coin price must break above the $0.00001300 resistance level, last tested in late May.
The memecoin has shown resilience following its recent decline. Technical patterns support a cautiously bullish outlook if key resistance zones are breached. However, without volume expansion or a broader altcoin rally, PEPE’s upward potential may remain limited in the short term.
PEPE Outpaces SHIB and DOGE as Rotation Evident
On the daily chart, PEPE appears to be outperforming its closest memecoin peers. Since the recent local peak, PEPE is down approximately 37.39%, while Shiba Inu (SHIB) and Dogecoin (DOGE) have dropped 39.37% and 39.61% respectively.
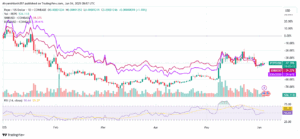
Though the margin is slim, the relative strength signals a potential capital rotation within the memecoin segment, with PEPE receiving more favorable short-term positioning.
The daily RSI sits at 50.64 after falling from an overbought reading of 70 in late May. This retreat from overheated conditions may serve as a reset, giving room for momentum to rebuild
