
The week’s story around PEPE features a completed Binance rewards event and a separate PepeNode presale claiming about $1.9 million raised alongside a browser “mine-to-earn” game. No new utilities or integrations for PEPE were announced in this window.
Binance’s PEPE reward window closed on Oct 17
Binance ran “PEPE Mega Airdrop Season” from Oct 14 to Oct 17 with a stated $1,000,000 pool. The exchange marked those dates as the campaign period, ending the distribution on Oct 17.
The activity targeted user engagement inside Binance rather than changing on-chain PEPE mechanics. It offered eligibility rules typical of exchange promotions and did not introduce governance, supply, or feature changes for the token itself.

With the window now shut, PEPE activity on Binance returns to standard programs unless a new, dated notice appears specifying additional terms. No such follow-on notice accompanied the Oct 14–17 campaign.
PepeNode presale claims ~$1.9M; pushes browser “mine-to-earn”
PepeNode says its ongoing presale has raised about $1.9 million to date. The project promotes a browser-based “mine-to-earn” game that simulates mining rigs and distributes rewards in its native token, with materials also referencing payouts in meme coins such as PEPE and Fartcoin.
Project and venue briefings describe tiered incentives, leaderboards, and high advertised staking APRs as part of the rollout. These mechanics sit within the PepeNode ecosystem and do not alter how PEPE functions onchain.
Some venues now circulate larger figures as the presale continues, but the most conservative, dated claim this week remains “about $1.9M.” Readers should treat this as a third-party initiative using frog-themed branding rather than a PEPE roadmap change.
Liquidity map flags short-wipe zone near 0.00000750
A fresh Coinglass liquidity heatmap shows dense resting liquidity above spot. The brightest band sits near 0.00000750, where short liquidations cluster. If price tags that pocket in one push, forced buys can accelerate the move.
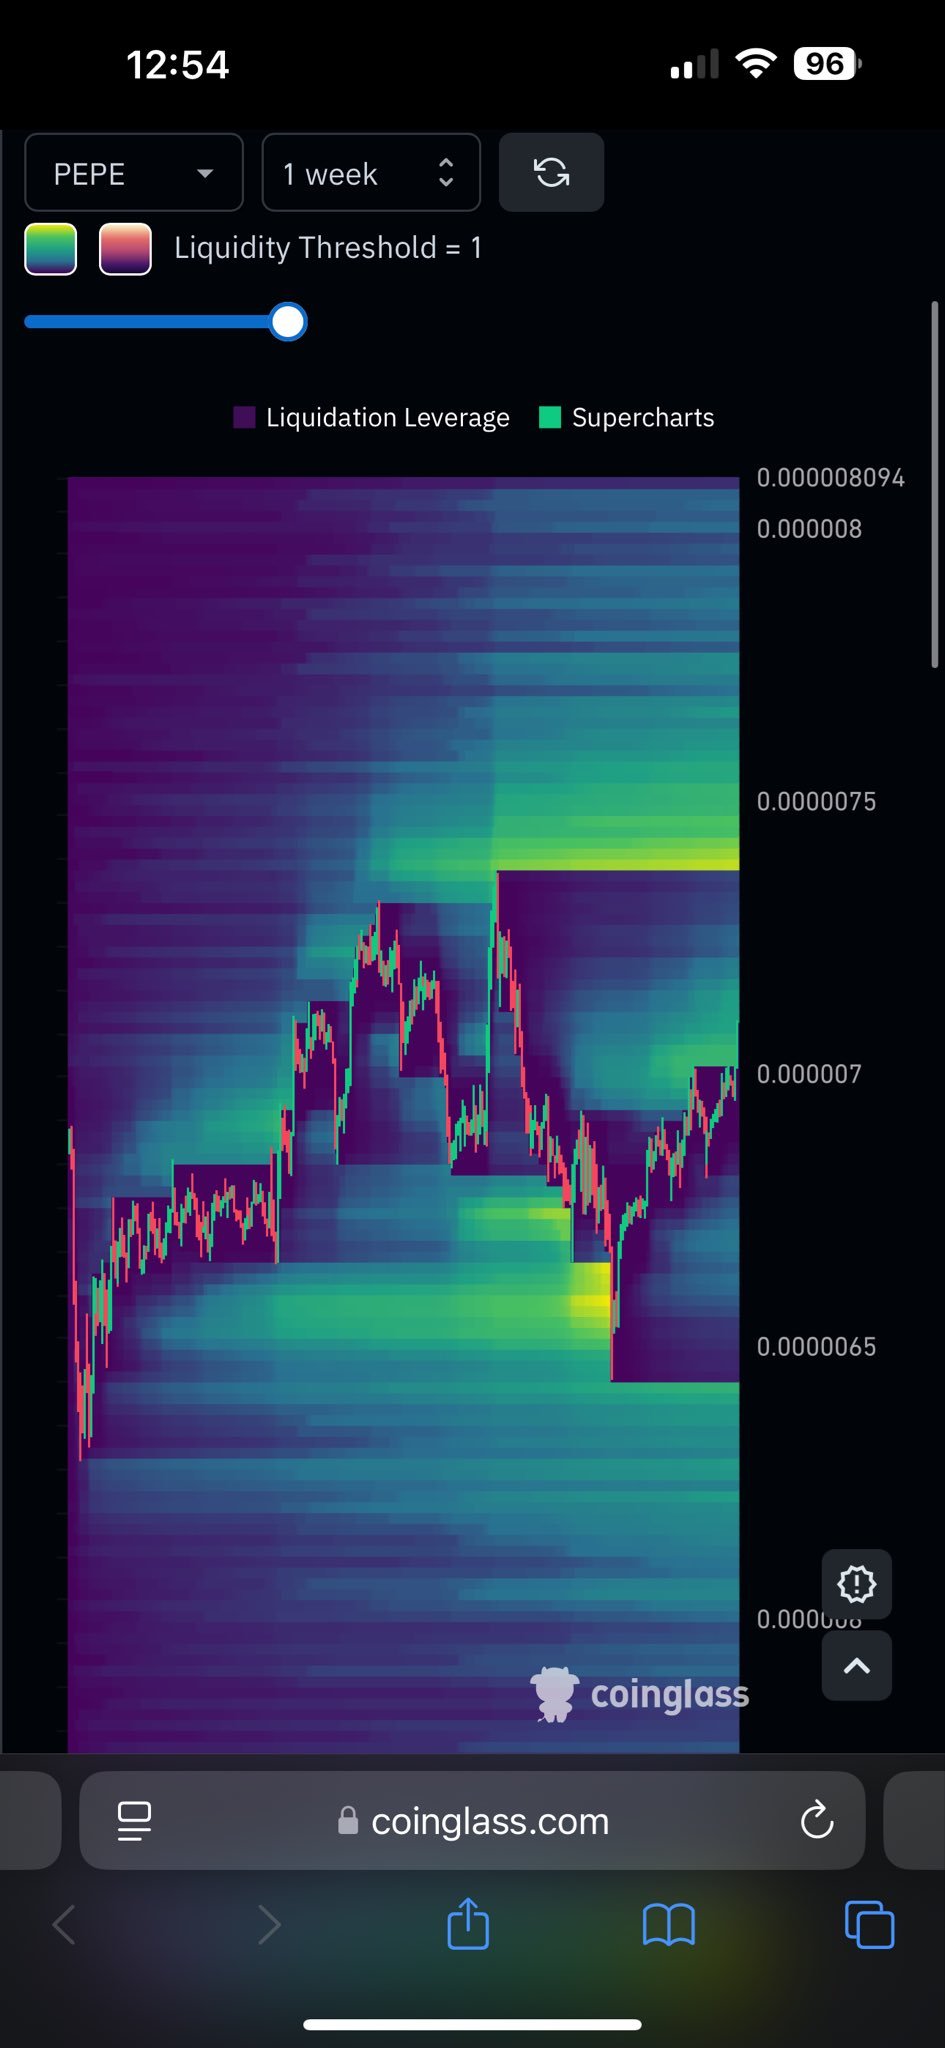
Below, the map fades into cooler tones around 0.00000650. That zone marks prior long liquidations and thinner bids. Consequently, a rejection from overhead could quickly revisit that shelf before balance returns. The profile therefore skews top-heavy in the near term.
Orderflow remains the hinge. A coordinated whale push or a broad risk bid could sweep the 0.00000750 pocket. Then cascading closes would lift tape speed as shorts cover. However, weak participation leaves overhead liquidity intact and limits follow-through.
Macro timing also matters. CPI arrives at 8:30 a.m., which often jolts crypto leverage. A positive surprise may clear overhead bands; a miss may flush into lower pools first. Either way, the heatmap outlines where liquidations likely cluster next, not a guarantee of direction.
PEPE sits third by memecoin market cap, second by daily volume in the snapshot
A fresh market table shows PEPE ranked behind Dogecoin and Shiba Inu by market value, placing it third among major memecoins in that view. The snapshot lists PEPE with a market cap near $2.9 billion, while Dogecoin leads and Shiba Inu follows. This positioning reflects capitalization at the time of capture, not a fixed ranking over all periods.
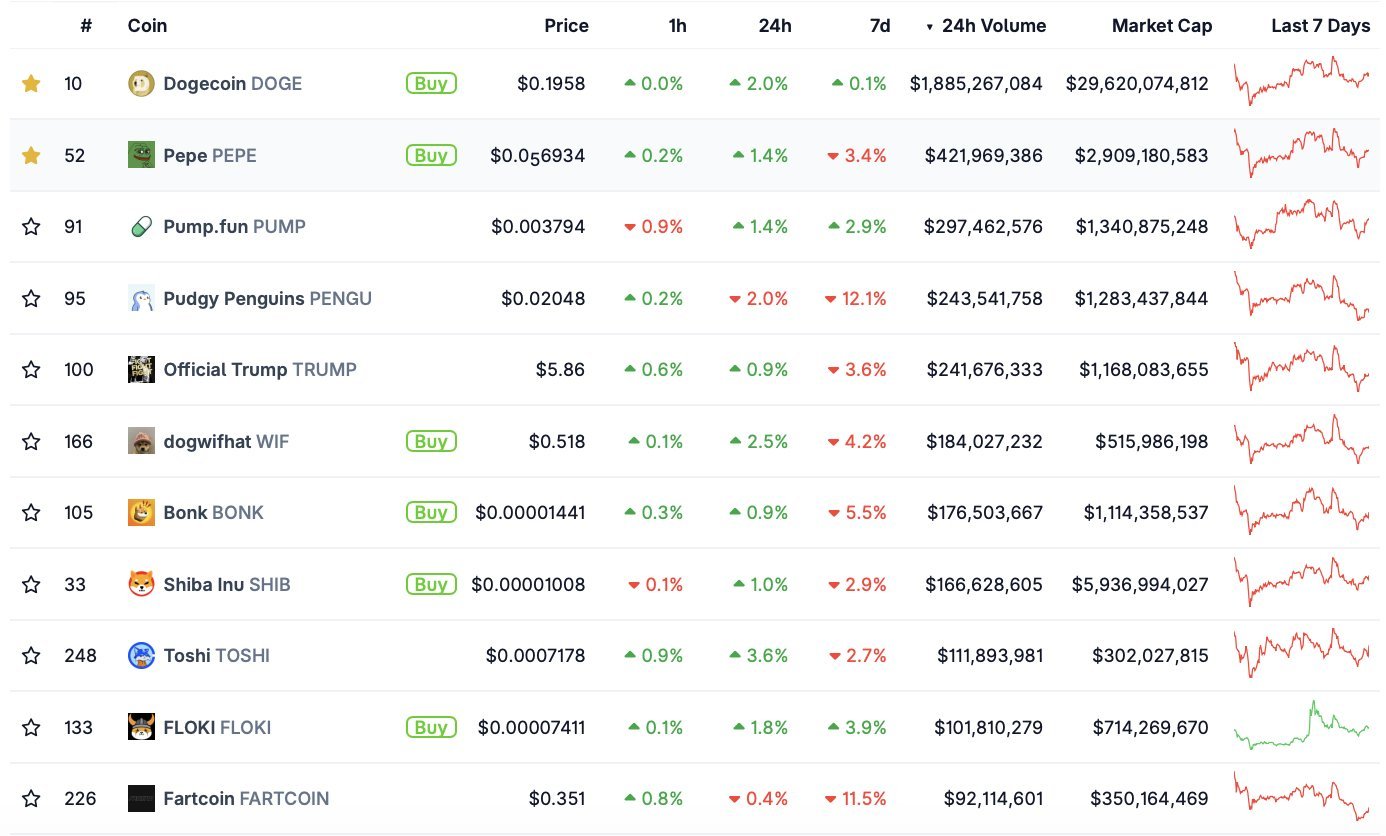
Volume data in the same table highlights liquidity. Over 24 hours, PEPE records about $422 million in trading, second only to Dogecoin’s roughly $1.89 billion among the coins shown. Other memecoins in the image trail by volume, indicating thinner turnover compared with PEPE during that window. Consequently, the feed suggests PEPE maintained strong exchange activity even as seven-day moves varied coin to coin.
The accompanying commentary asserts PEPE has held this stature for 1.5 years and achieved it without influencer spend. Those are claims from the author, not independently verified in the image. The post also labels PEPE the “best risk-to-reward setup,” which is opinion. The verifiable takeaway from the screenshot is narrower: at the time captured, PEPE ranked third by memecoin market cap and second by daily volume among the tokens displayed.
PEPE compresses into converging trendlines as price tests rising base
The chart shows PEPE coiling inside a large triangle, with a descending trendline capping rallies and a gradual, rising base supporting pullbacks. Price now sits near that base, where prior reactions sparked bounces. Volume has tapered during the squeeze, a typical pre-breakout behavior that often precedes a directional move.
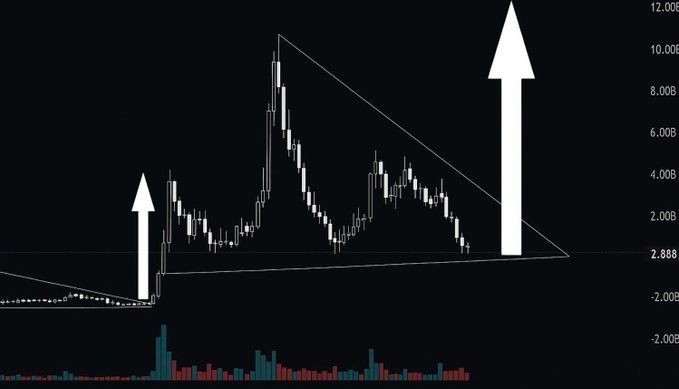
If buyers reclaim the descending trendline on strong volume, momentum can expand quickly as resting offers get cleared. A confirmed breakout would then use the pattern’s height to estimate follow-through, putting prior swing zones back on the map. Until that close arrives, the setup remains unresolved and range-bound.
Conversely, a decisive daily close below the rising base would invalidate the bullish read and hand control to sellers. In that case, flows would likely probe the next liquidity shelf from earlier consolidation. Therefore, the next high-volume impulse—up through trendline resistance or down through base support—will define the move rather than the arrows implied on the image.
PEPE tests breakout over intraday pivot; eyes 0.00000720–0.00000740 band
PEPE/USD 1-hour Binance chart shows a push through a short-term lower-high cluster, turning the 0.00000685–0.00000690 area into a pivot. Candles cleared that shelf with a small volume uptick, signaling an attempted shift from repair to expansion. The move comes after a series of higher reaction lows formed during the prior session.
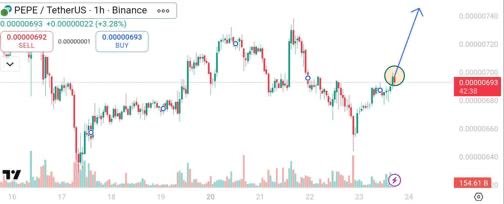
Above, the first supply band sits around 0.00000720–0.00000740. That zone capped bounces earlier in the week and aligns with a local imbalance left by the prior selloff. If momentum carries through, reclaiming and holding over this band would confirm control shifting to buyers on the intraday timeframe.
However, the breakout remains fragile while the tape trades near the pivot. Failure to hold 0.00000685–0.00000690 risks a slip back toward ~0.00000670, where bids previously stabilized the slide. In short, the structure favors continuation only if price sustains above the new pivot and chews through the 0.00000720–0.00000740 supply zone.
